


Have you ever thought about how your LinkedIn posts are performing—are they making a meaningful impact or just getting lost in the digital noise?
You are not alone.
With LinkedIn's massive user base, standing out is tougher than ever, and everyone has the same goal—to set oneself apart.
In this blog post, we will try to lead you from "just another profile" to "can't-miss connection"!
How can we do it?
We will walk you through LinkedIn Analytics: The Complete Guide.
Ready to kick off?
What is LinkedIn Analytics?
LinkedIn analytics represent all the data and statistics behind your LinkedIn activity.
It includes a set of tools and measurements to assess the effectiveness of a user's or company's presence on LinkedIn.
Understanding LinkedIn analytics is crucial for gaining insights into your audience, their engagement with your content, and the success of your social media strategy on the platform.
It tracks and provides insights into various performance indicators, such as:
- views,
- engagements,
- impressions,
- followers,
- clicks,
- shares,
- comments,
- and audience demographics.
This data helps users understand how their content resonates with their target audience, enabling them to optimize their LinkedIn strategies, enhance their content, and build stronger professional connections.
How to Access Analytics Using LinkedIn Native Analytics Tool?
The integrated LinkedIn analytics tool is conveniently located within your LinkedIn dashboard, making it easy to access.
It offers comprehensive insights over a range of metrics and time frames.
LinkedIn Native Analytics tool is accessible to all page administrators, and it’s free of charge.
LinkedIn Analytics for a Company Page
To access the LinkedIn dashboard, you need to:
- Go to your company's page.
- Click on the analytics tab.
- Check out the analytics overview on the right side for a quick snapshot of your last 365 days of activity.
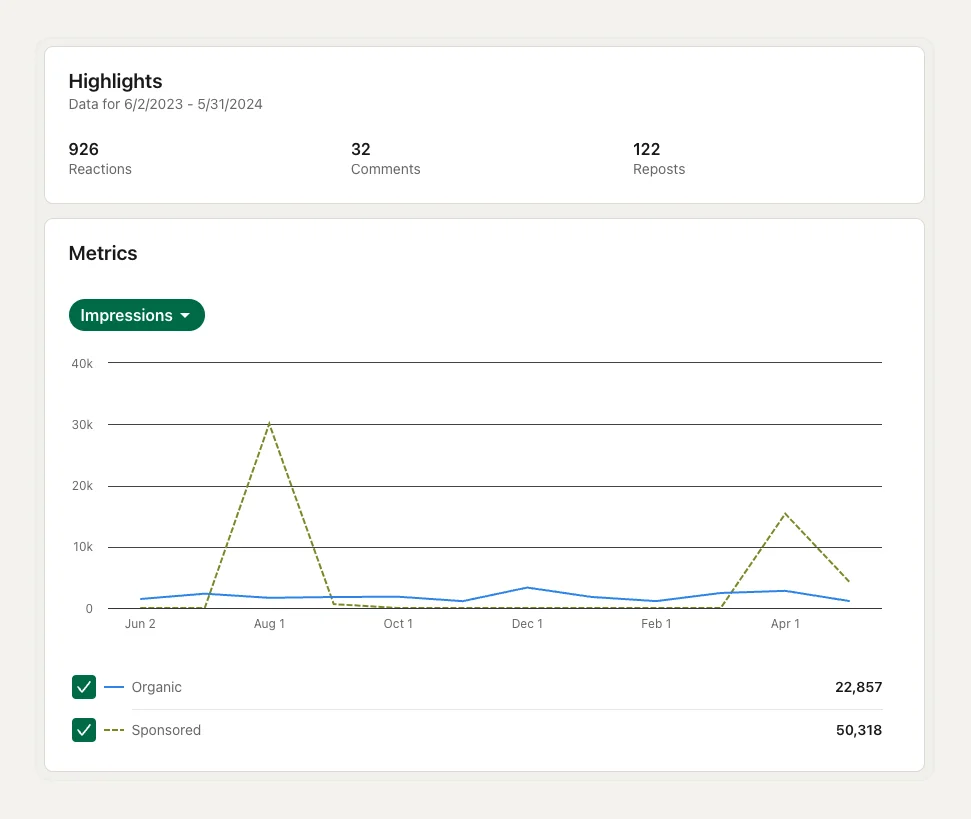
And here's a breakdown of the different types of analytics available:
👉 Content Analytics—Measures the effectiveness of your updates in order to evaluate the topics and quality of content shared with your page followers and visitors.
👉 Followers Analytics—Shows you the demographics and where your followers come from, so you can understand who follows you and how to engage with those followers effectively.
👉 Visitors Analytics—Understand your visitors and figure out how to turn them into followers by gaining insight into the types of people who visit your Page.
👉 Leads—Download information on members who have completed lead generation forms on your Page in the last 90 days and gather high-quality leads.
👉 Competitors Analytics—Compares your Page's followership and content engagement with competitors.
👉 Employee Advocacy Analytics—Tracks engagement with recommended content to evaluate its quality and engagement.
👉 Employer Brand Analytics—Measures engagement with your Career Pages to help understand how to improve audience engagement.
👉 Newsletter Analytics—Tracks newsletter performance and audience to review trends, article totals, and subscriber demographics for optimizing content quality.
LinkedIn Analytics for a Personal Profile
To start monitoring data for your LinkedIn personal profile, simply follow these easy steps:
Step #1: Open a LinkedIn home page.
Step #2: Go to your Personal Profile.
Step #3: Scroll down to the Analytics section and click on Show all analytics.
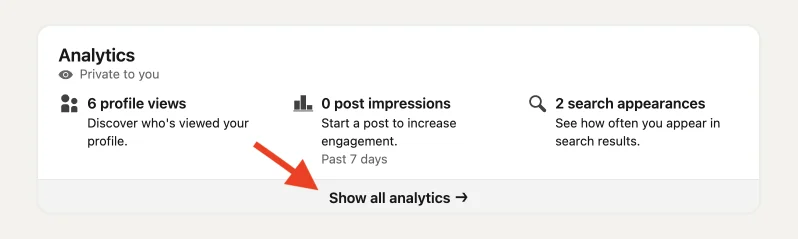
Step #4: Choose the tab for the metrics you want to know.
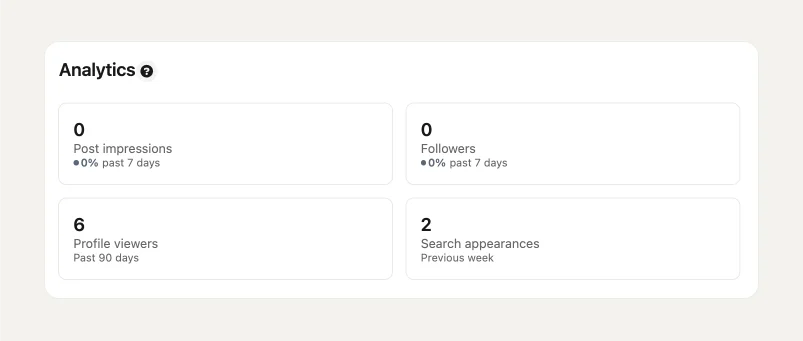
Here you can track:
- Post impressions—the number of times your posts were shown on the screen.
- Followers—the total number of people that follow you.
- Profile viewers—the number of people who viewed your profile.
- Search appearances—the frequency with which your profile has been displayed in search results.
Pro Tip 💡
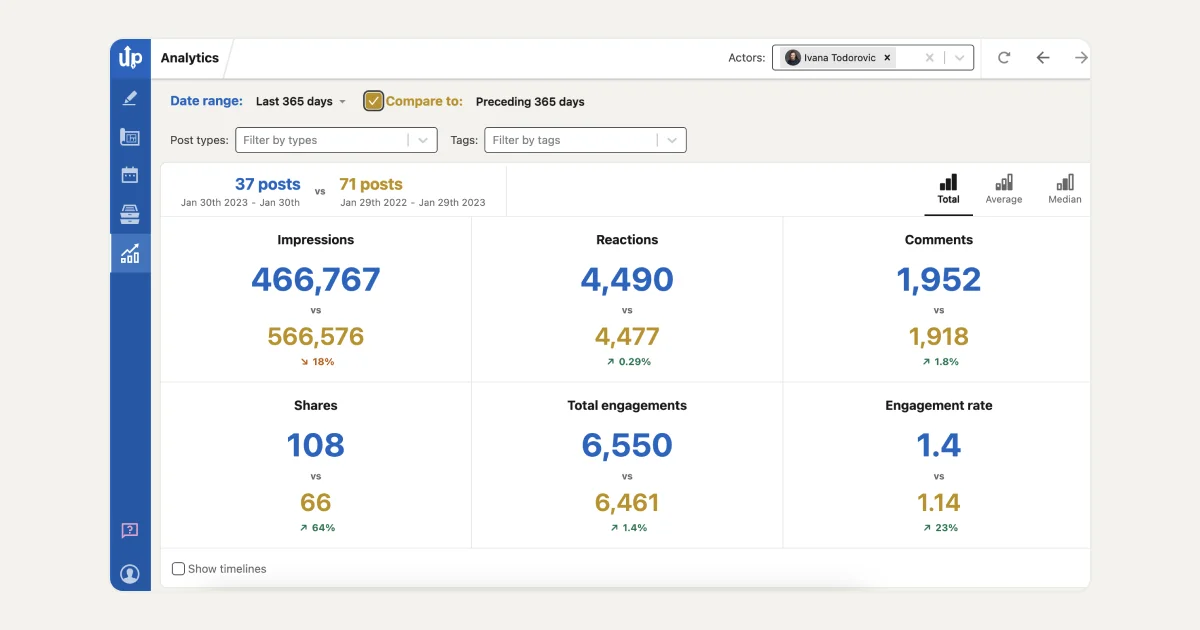
AuthoredUp offers advanced analytics for LinkedIn profiles and pages.
This fantastic feature is used to track your impressions, reactions, comments, shares, and engagement rate - all these data given in three values: median, average, and total.
Use the free LinkedIn engagement rate calculator to benchmark your posts against real data from 476,000+ posts
How to Check Individual LinkedIn Post Analytics?
Do you want to check the performance of a specific post?
This is how you can do it:
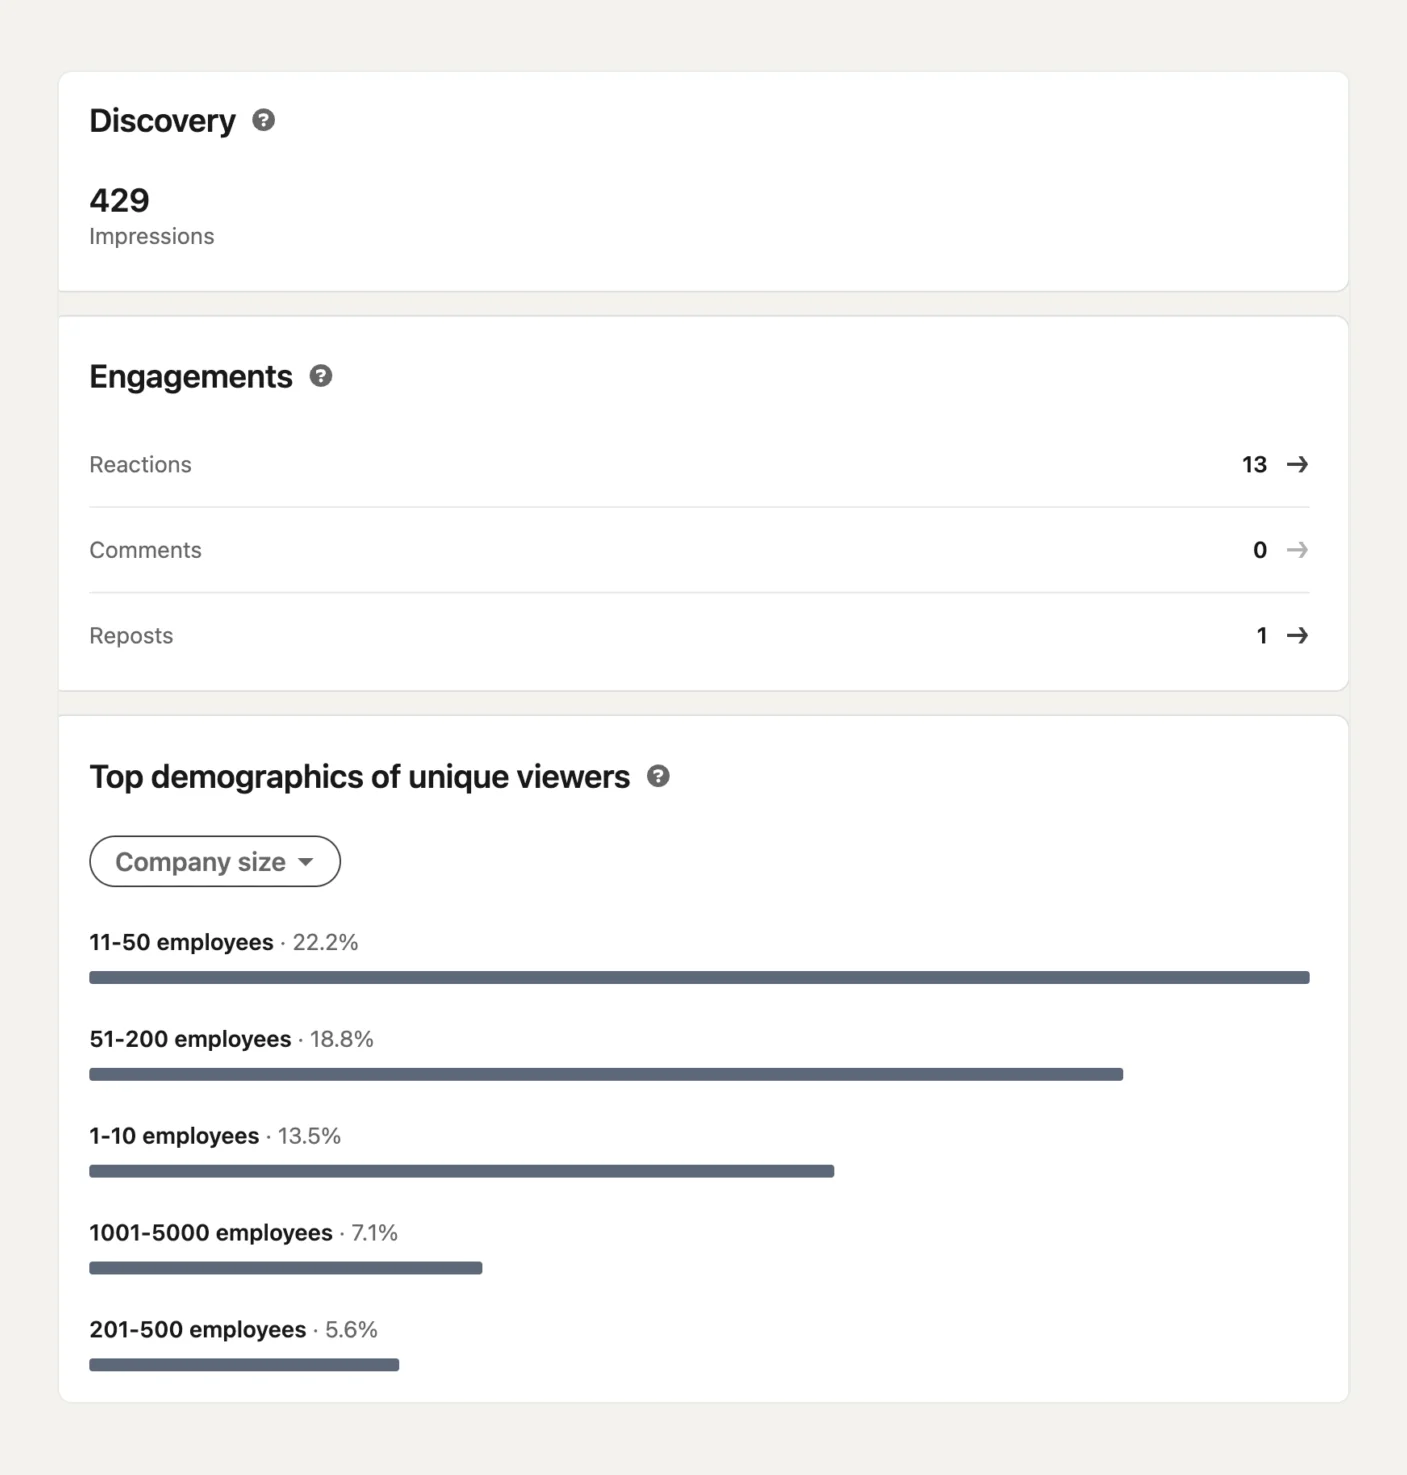
- Click on View analytics at the bottom of your post.
- Here, you can see the number of impressions and engagements your post has received.
- In the Engagements section, you can view reactions, comments, or reposts.
- You can also check the demographic information to see the types of people who saw your content.
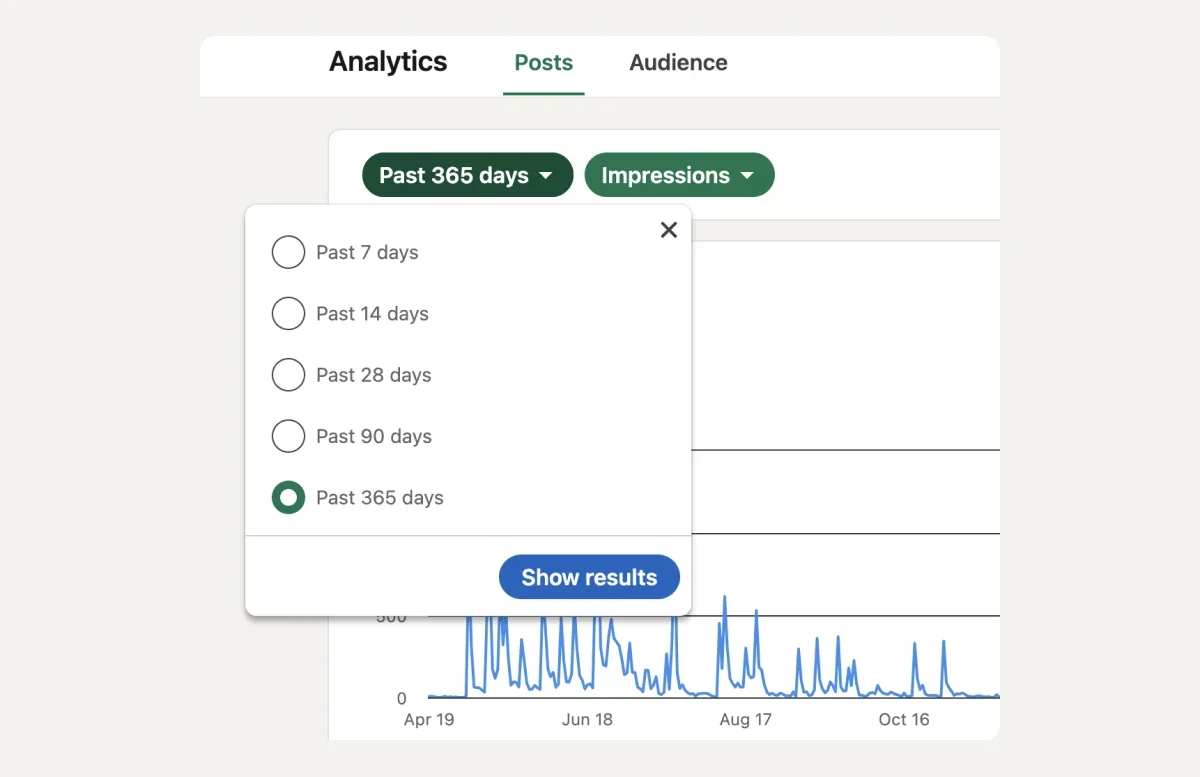
On LinkedIn, you can track the performance of your posts by analyzing their impressions over various time periods such as 7, 14, 28, 90, or 365 days.
The data is presented with graphical representations for easy interpretation.
Remember that high impressions mean your content is reaching a lot of people, which is important for increasing brand visibility and establishing your authority.
On the other hand, low impressions might mean you need to change your content strategy or posting schedule to better meet your audience's needs.
What do these numbers mean to you?
All of these analytics insights will help you understand what is working and what is not.
This way, you can modify your content strategy for the future.
Pro Tip 💡
AuthoredUp’s Posts feature allows you to see all your LinkedIn posts in one place in the table format.
Here you can see the number of likes, shares, comments, and filter posts by tags, keyword, type or date range.
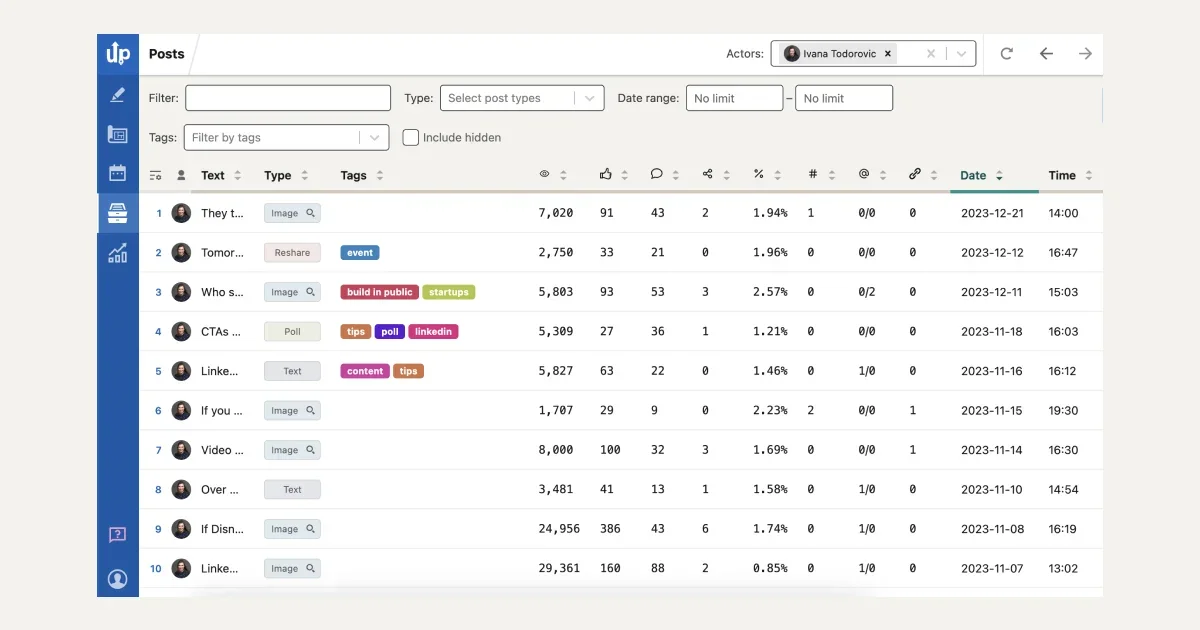
From here, you can easily keep in touch with people from your industry and return to these posts to keep the conversation going in the comment section.
Why is LinkedIn Analytics Important?
Monitoring your LinkedIn analytics enables you to leverage data for enhancing your marketing strategy.
By consistently tracking this data, you can drive better results and maximize your ROI.
In order to develop an effective marketing strategy, simply planning and posting content is not sufficient.
It is crucial to track relevant metrics and analyze post performance.
LinkedIn Page Analytics provides various insights to help you understand and optimize your Page's performance.
Analytic Metrics You Should Track and Know
Dealing with too much data can be overwhelming when tracking metrics.
But take it easy- it's not necessary to focus on every single metric at your disposal.
Try to prioritize and focus on the metrics that are most relevant to your business goals, rather than trying to keep track of every single one.
To assist you with this, we have explained LinkedIn metrics that every marketer should be aware of:
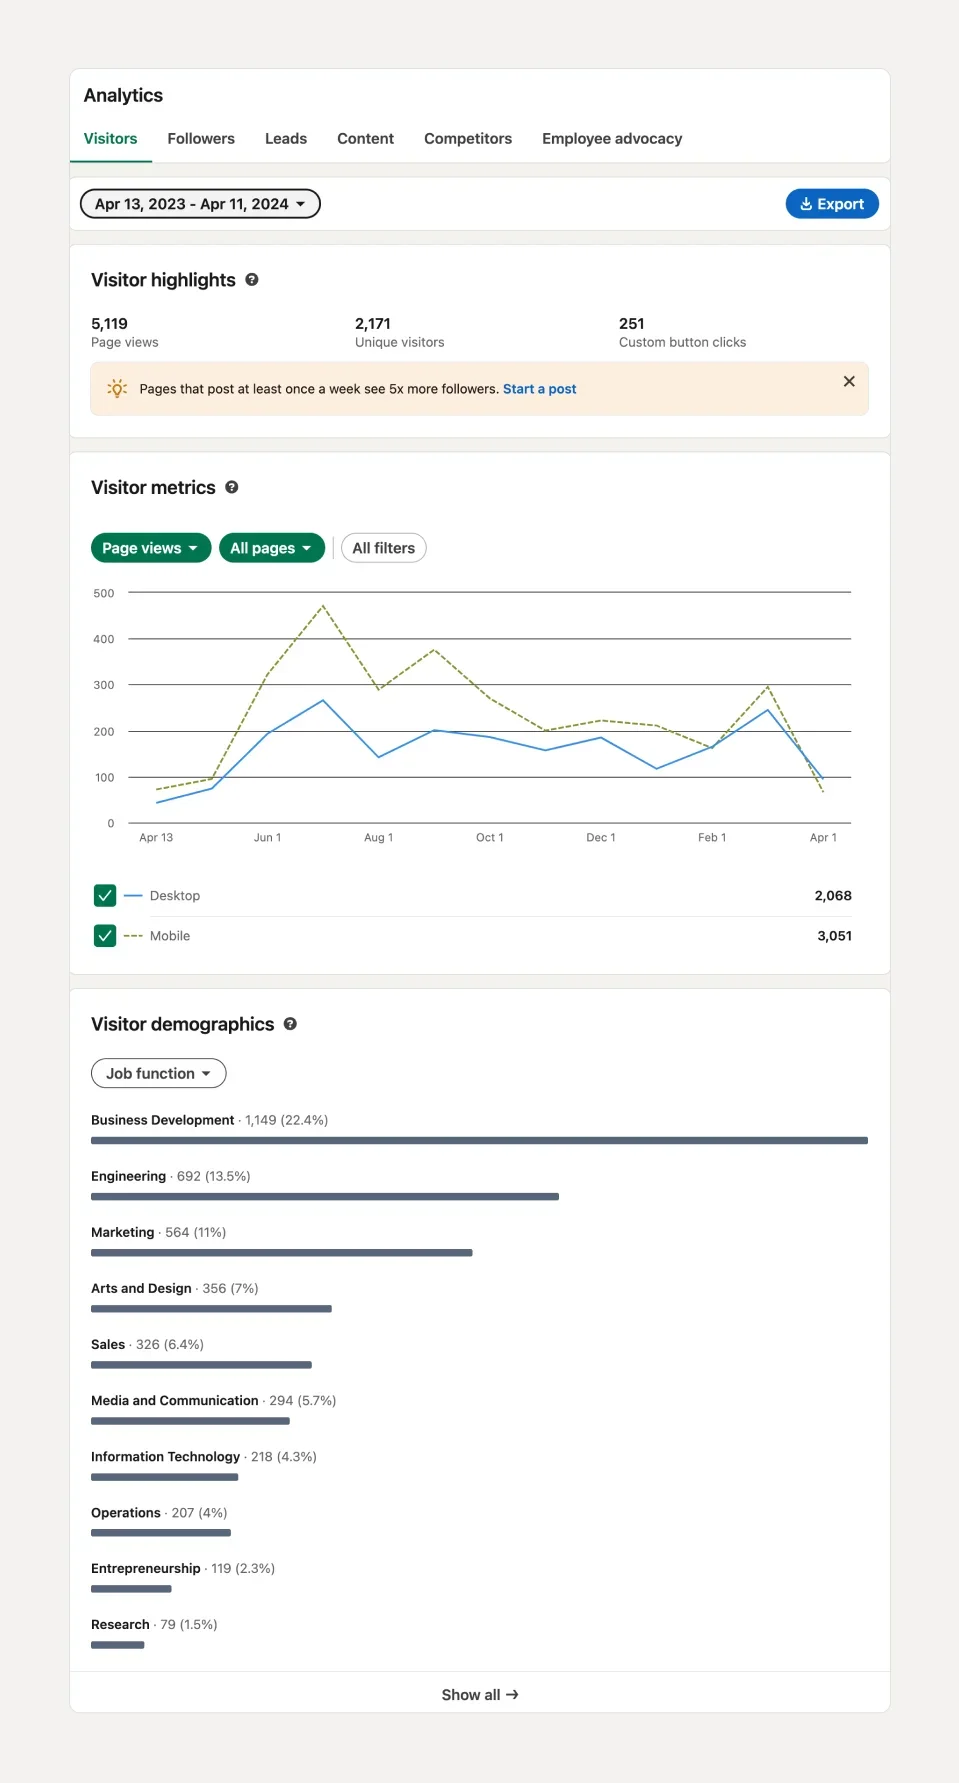
👁️🗨️ Visitor Analytics - When you check Visitor Analytics, you can see who has viewed your LinkedIn page.
Key metrics include:
- Page Views - which count all views over a period, including repeat views from the same user.
- Unique Visitors - which count distinct users to give a clearer picture of the number of interested individuals.
- Visitor Demographics - which provide detailed information about the viewers, such as their location, industry, job title, company size, and seniority.
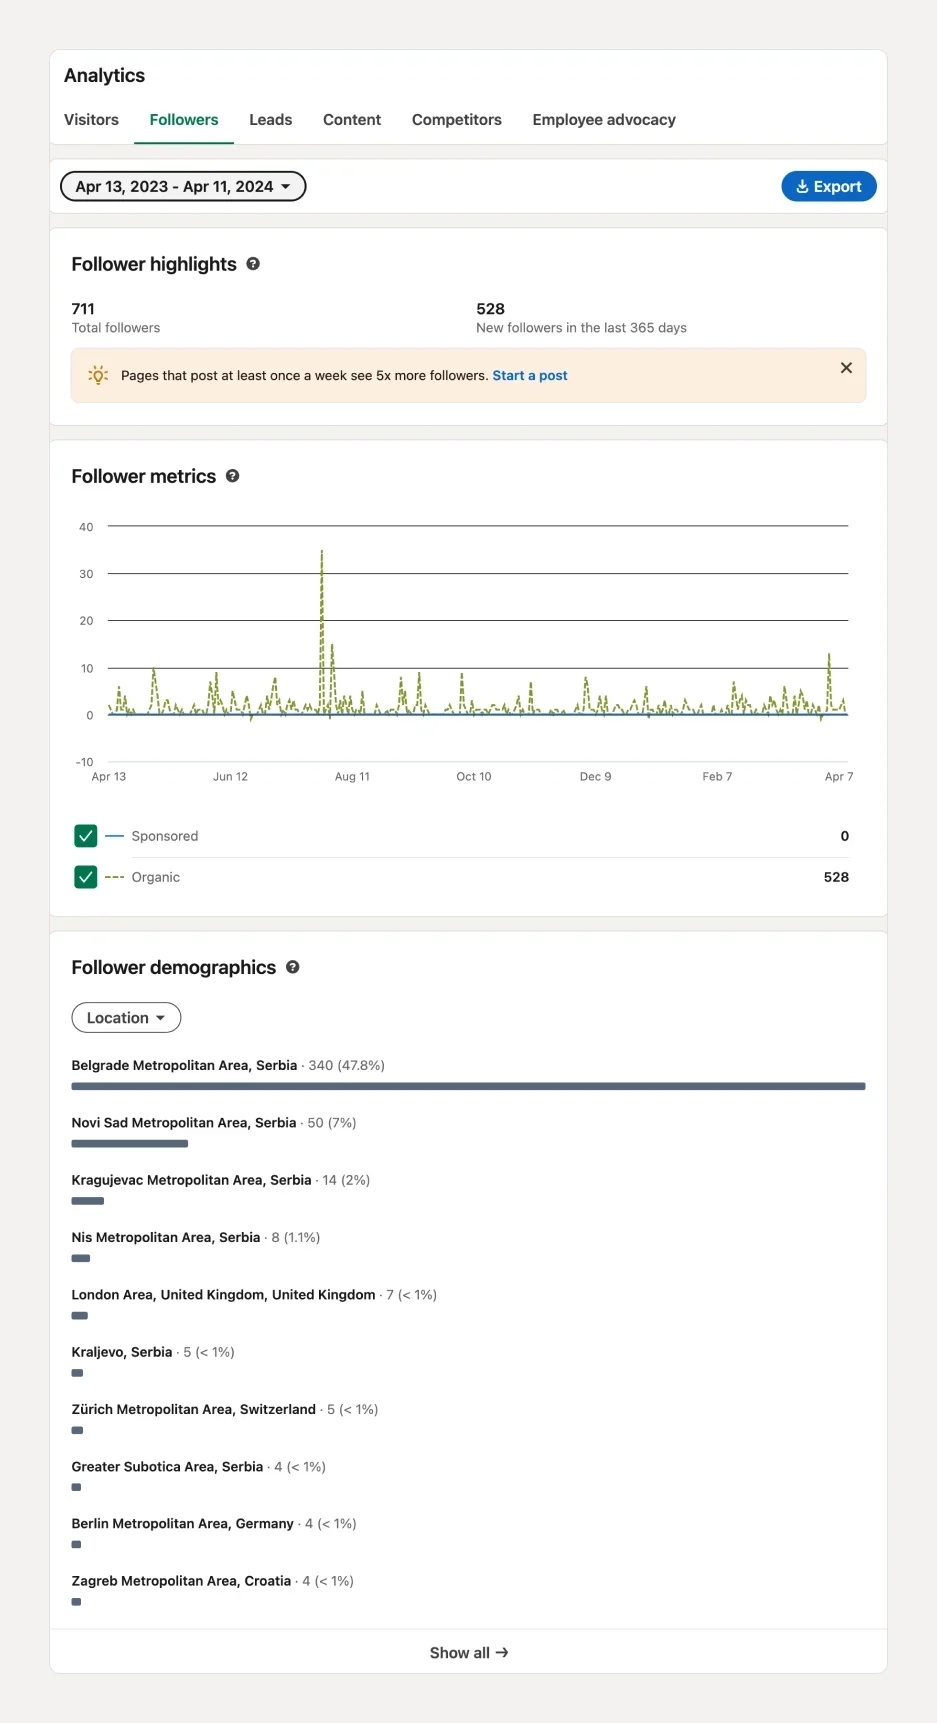
👁️🗨️ Follower Analytics -By understanding who follows your page, you can create better content to engage with your LinkedIn community.
This helps you see how your brand is reaching and affecting people on the platform.
You can track:
- Total followers—The precise number of followers on your LinkedIn page, indicating how popular and trustworthy your brand is on LinkedIn.
- Follower trends—The number of new followers you gain over a specific time period. Keep track of this in order to see if your follower count is increasing, decreasing, or fluctuating.
- Organic followers—All the individuals that discovered your page through searches or shared posts.
- Follower demographics—The information about your followers about where they are, how important their job is, what industry they work in, how big their company is, and what they do at work.
👁️🗨️ Engagement Analytics — It’s important to track the success of your marketing, such as campaigns, posts, and videos so you can use these data to see if your content is resonating with your target audience and how they're interacting with it.
Make sure to track:
- Impressions—The number of times LinkedIn users have viewed your post.
- Video Views—The number of people who have viewed your video.
- Reactions—The number of people who reacted to your post with "Like," "Celebrate," "Support," "Funny," "Love," "Insightful," or "Curious."
- Remarks—The number of comments that your post has received in response to it.
- Shares—The quantity of times LinkedIn users have shared your content.
- CTR (Click Through Rate)—The number of clicks your post received divided by the number of impressions your post received.
- Follows—The total number of Follow clicks on your sponsored content on LinkedIn.
- Engagement rate—This is the sum of all user interactions (likes + comments + shares + clicks on your post.)
Consider your objectives when selecting the key metrics to prioritize.
For instance, if your brand aims to attract new audiences through its posts, focus on content analytics.
To enhance brand visibility on the platform, monitor followers' and visitors' analytics.
If you prefer a hands-on approach, you can also build a custom LinkedIn analytics dashboard tailored to your goals
Regardless of the metrics you choose to track, there's an all-in-one analytics tool that meets all your needs.
Introducing AuthoredUp!
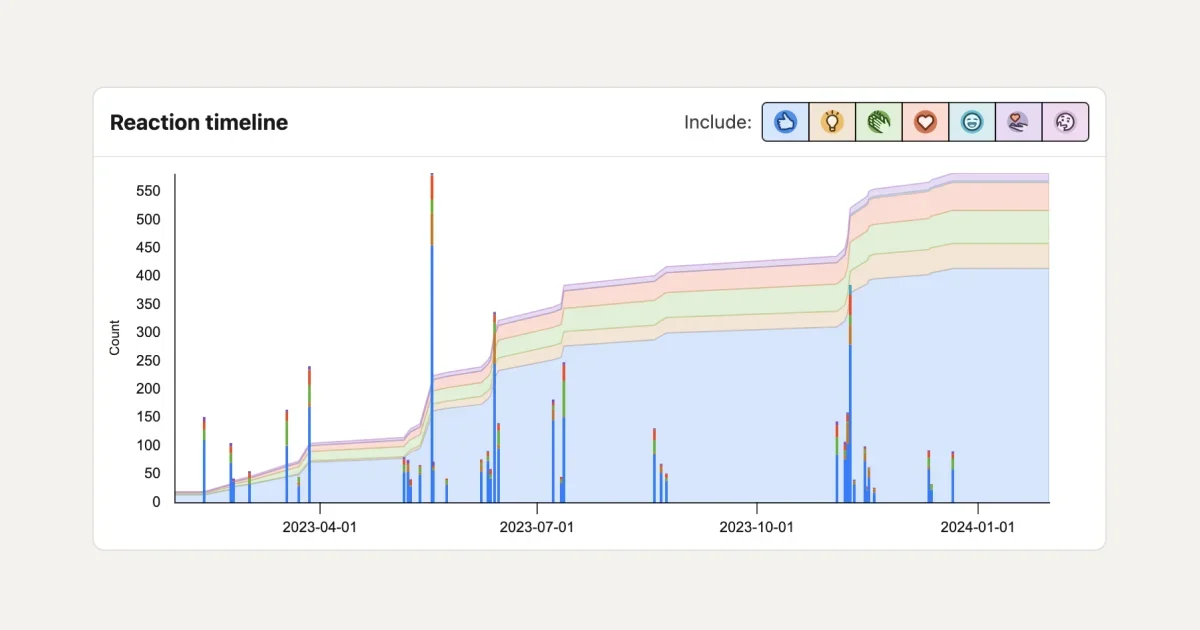
Pro Tip 💡
AuthoredUp's Reaction Timeline shows how people feel about your posts.
Each bar represents a post, and different colors represent the different feelings people have, which gives you invaluable insight into their reactions to your posts.
Best LinkedIn Analytics Tool
When it comes to the best LinkedIn analytics tools—AuthoredUp is a cut above the rest.
It provides a comprehensive approach to LinkedIn content strategy, including creation and analysis.
Let's take a closer look at how AuthoredUp can enable you to follow and increase your LinkedIn presence in terms of analytic performance:
🌟 Post Comparison—You can compare two posts side by side to understand what content works best.
🌟 Hashtag Analysis—You are offered insights into hashtag performance which will help you optimize your post reach and engagement.
This is where you can see hashtags that worked well for your audience.
🌟 Profile Performance Analytics—Analyze your profile performance over time, and accordingly make data-driven decisions for future content strategies.
Upon opening the Analytics tab, you can track your impressions, reactions, comments, shares, and engagement rate.
🌟 Specific Time Period Analysis—Analyze your LinkedIn profile's performance over a specific time frame and assess growth and the impact of your strategies during specific times.
🌟 Historical Post Analysis—Collect and analyze your existing content so you can understand the performance of your previous posts.
Conclusion
Now that you have come this far, it should be crystal clear that LinkedIn analytics represent more than just numbers.
When considering all the benefits of LinkedIn analytics, you realize that you need a feature-rich third-party LinkedIn analytics tool such as AuthoredUp.
So if you want to start exploiting the power of LinkedIn analytics—start today by unlocking the full potential of AuthoredUp—best LinkedIn analytics tool in the market.
Being fully equipped with a vast number of features, this comprehensive tool will help you grow on LinkedIn.
Use AuthoredUp to:
🚀 Easily preview your posts across multiple devices.
🚀 Create compelling text with bold and italic formatting, bullet points, and more.
🚀 Move between drafts with ease, take notes, and schedule posts for later.
🚀 Get access to more than 200 hooks and 100 CTA templates.
🚀 Manage all your LinkedIn posts and statistics, including historical data.
🚀 Repost any content with just one click.
🚀 Check your readability score to make sure your content is simple to scan and understand.
🚀 Simplify the process of managing several LinkedIn profiles in one place.
🚀 Use our new Content Calendar to easily manage your planned content.
Keep in mind that all this power is available both on the AuthoredUp platform and via the Chrome Extension.
Your content analytics are just a click away.
Sign up now to explore AuthoredUp's full potential!
.png)
.png)
.png)
