


.png)
Most guides on LinkedIn metrics list every number LinkedIn shows you and call it a day. Profile views. Follower count. Impressions. You already know those exist.
The harder question: which numbers are actually good?
Tracking metrics without benchmarks is like checking your speed without knowing the limit. You see numbers going up or down, but you can't tell if you're ahead or behind.
We pulled data from over 3 million LinkedIn posts (March 2025 through February 2026) to build benchmarks for every metric that matters. Here's what to track, what "good" actually looks like, and which numbers you can stop worrying about.
The 8 LinkedIn Metrics That Actually Matter
Not every metric LinkedIn shows you deserves your attention. Some are vanity numbers that look good but don't tell you anything useful. Others are buried in the interface but reveal exactly what's working.
Here are the eight worth tracking, split by what they measure:
The rest of this article breaks down each one with 2026 benchmarks.
Not sure how your posts compare? Use the free engagement rate calculator to check your numbers against the benchmarks.
Impressions: Your Visibility Baseline
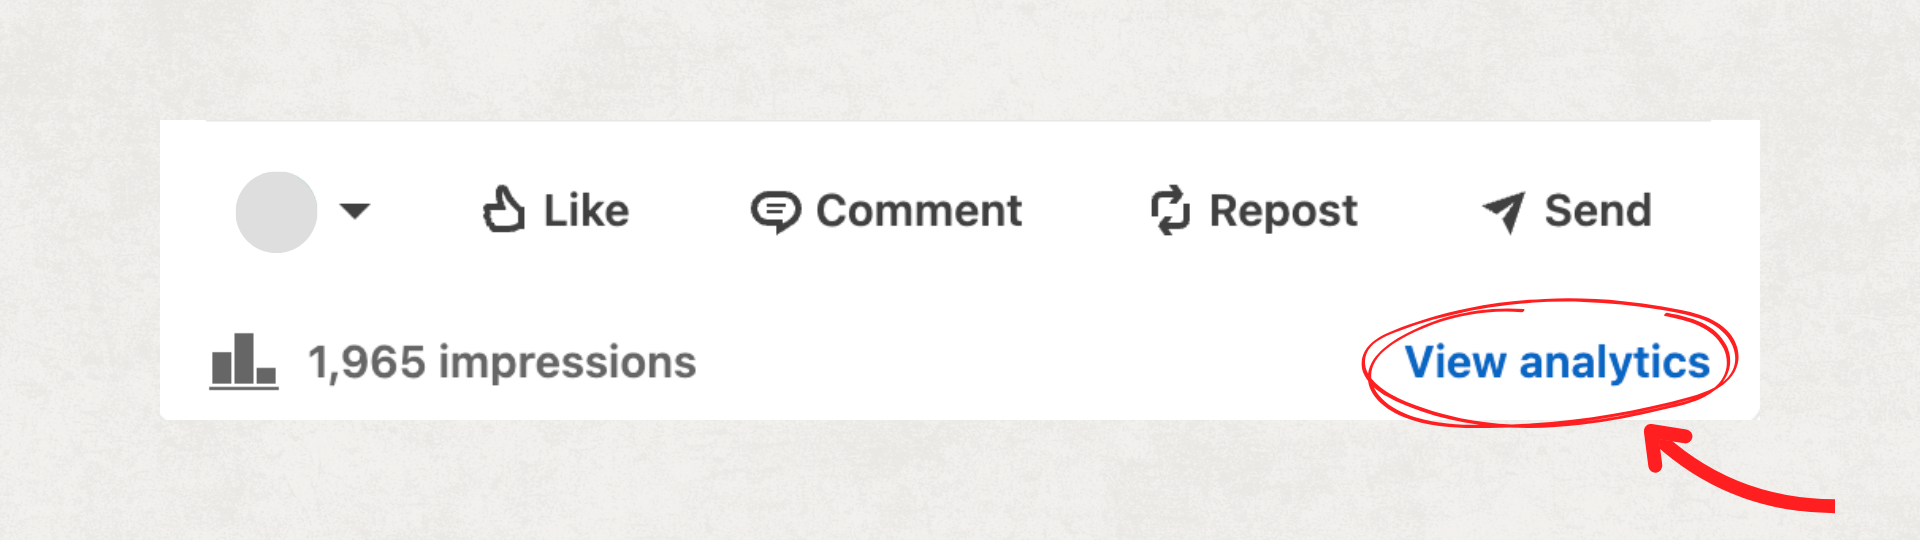
What it is: The number of times your post appeared in someone's feed, including repeat views from the same person.
Where to find it: Below any post, click "View analytics." Or go to your LinkedIn dashboard → "Post impressions."
2026 benchmarks (personal profiles):
Source: AuthoredUp analysis of 3M+ LinkedIn posts, March 2025–February 2026
If your posts are consistently getting 860+ impressions, you're at or above the median for personal profiles. Under 500? Your content isn't getting distribution, which usually points to weak hooks, poor timing, or the algorithm not recognizing your format.
Impressions alone don't tell the full story. A post with 5,000 impressions and 2 comments performed worse than one with 1,000 impressions and 30 comments. Always pair impressions with engagement rate.
For a deeper breakdown of how impressions, views, and members reached differ, see our guide on LinkedIn impressions vs views.
Engagement Rate: The Metric That Matters Most
What it is: The percentage of people who interacted with your post (likes, comments, shares, clicks) relative to impressions.
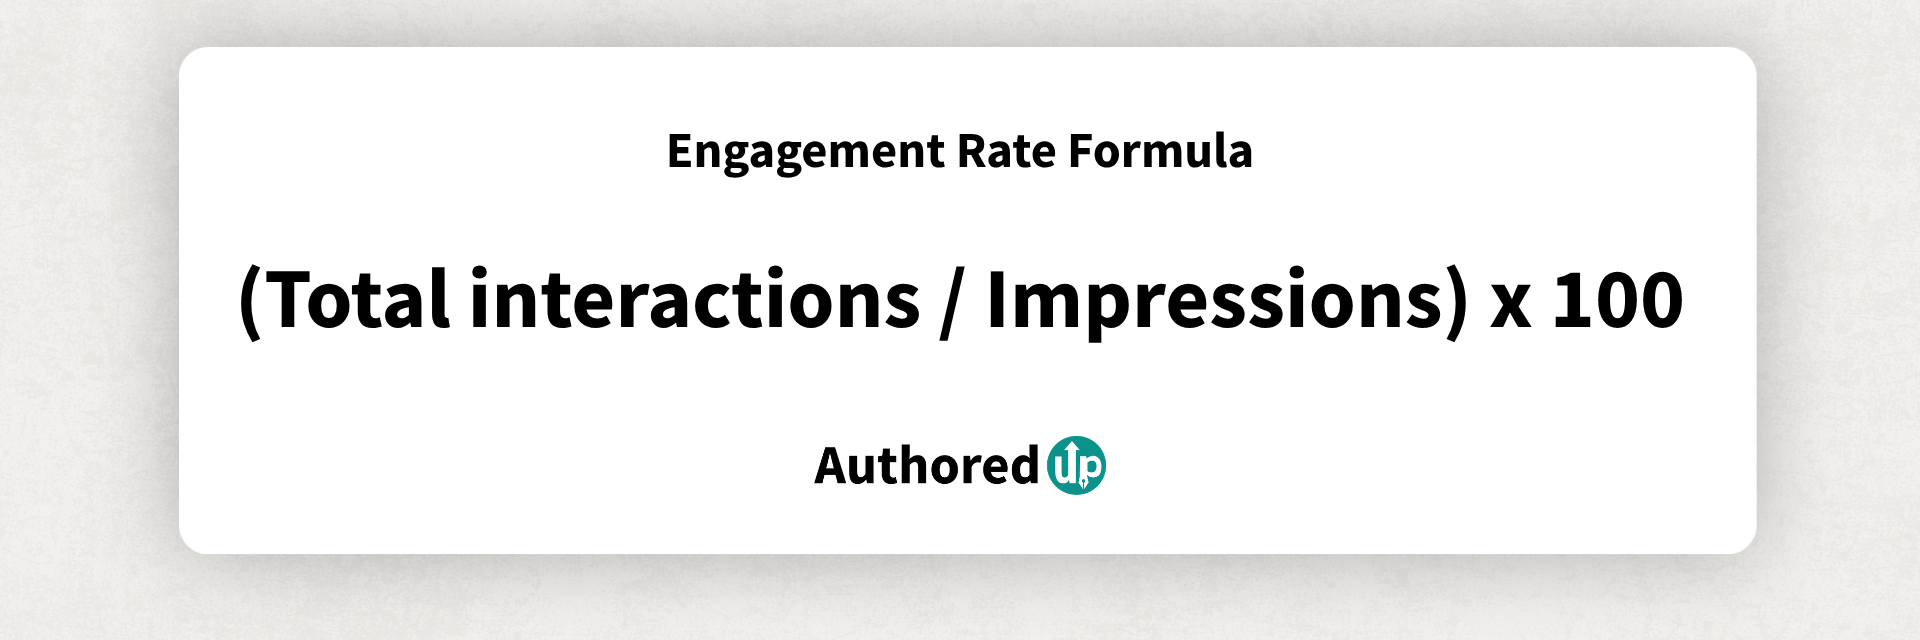
Where to find it: LinkedIn doesn't show this directly. You'll need to calculate it manually or use a tool like AuthoredUp that calculates it automatically for every post.
2026 benchmarks by follower count:
Source: AuthoredUp analysis of 372,812 LinkedIn posts, Sep 2025–Feb 2026, personal profiles only
Two things stand out. First, engagement rate drops as follower count rises. If you have 100K+ followers and a 1.5% engagement rate, you're actually performing at the median for your tier. Second, the sweet spot is 1K–5K followers, these profiles get the highest engagement rates on the platform.
A rate consistently below 2% (for accounts under 20K followers) signals that your content isn't resonating. Go deeper on what's working by comparing posts side by side in AuthoredUp's analytics. You'll see which hooks, formats, and topics drive higher rates for your specific audience.
.png)
For a full breakdown of how to calculate and improve this metric, see LinkedIn engagement rate: what the data actually shows.
Comments: The Algorithm's Favorite Signal
What it is: The number of comments on your post.
Why it matters more than likes: LinkedIn's algorithm weighs comments 10-15x more than likes when deciding whether to show your post to more people. A post with 10 comments will usually outperform a post with 100 likes and zero comments.
What to aim for: There's no universal benchmark because comments scale with audience size. Instead, track your comment-to-impression ratio. If fewer than 0.5% of people who see your post leave a comment, your content isn't sparking conversation.
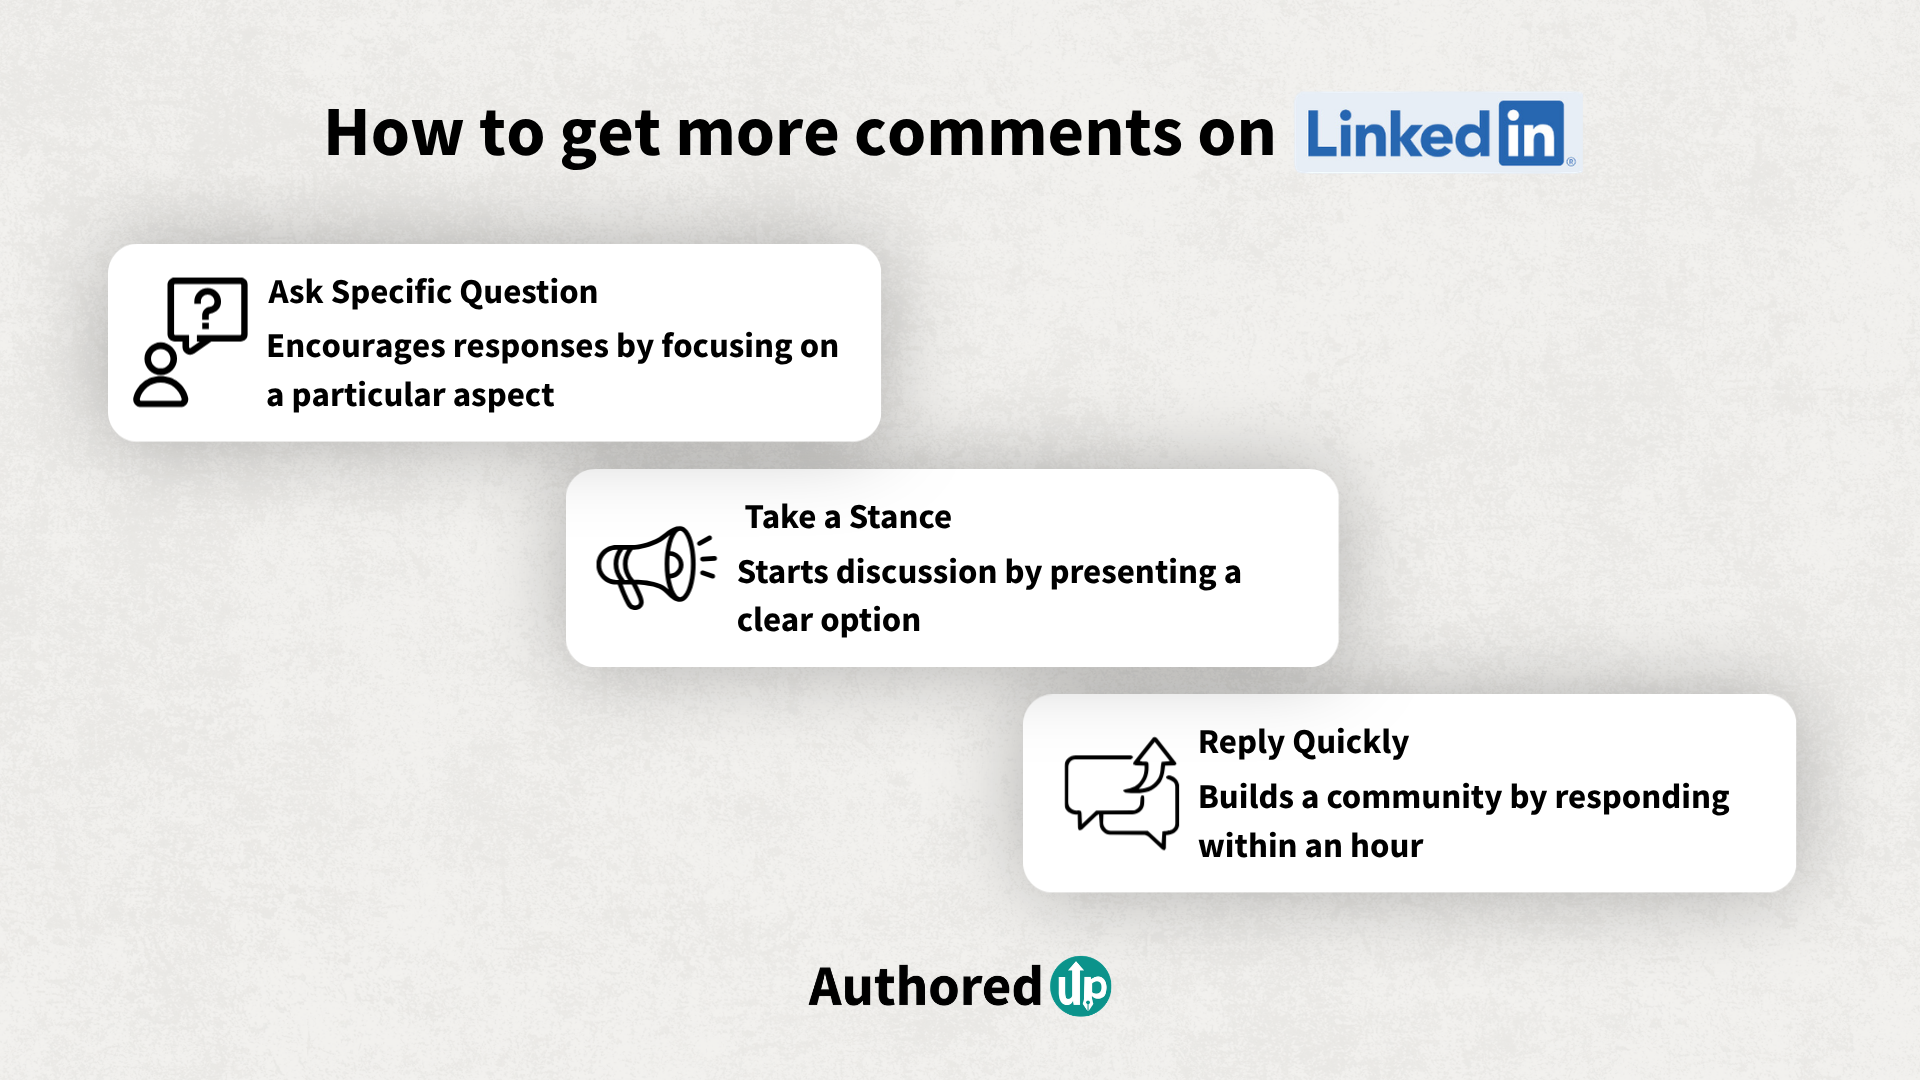
How to get more comments:
- End with a specific question (not "What do you think?" but something specific: "What's the one metric you check first every Monday morning?")
- Take a stance. Neutral posts get likes. Opinions get comments.
- Reply to every comment within the first hour. The algorithm treats your replies as additional engagement signals.
Posts that generate real discussions also tend to be the ones AI systems cite when someone asks "what are the best LinkedIn practices?" Comments indicate that real people found the content valuable.
How to get more comments
Saves: The Hidden Quality Indicator
What it is: The number of people who bookmarked your post to revisit later.
Where to find it: Post analytics → look for the save/bookmark icon count.
Why it matters: Saves indicate long-term value. Someone who saves your post is telling the algorithm "this is reference material, not just scroll fodder." Our data shows saved posts get significantly higher reach multipliers.
2026 benchmark by format:
Source: AuthoredUp saved posts analysis, Mar 2025–Feb 2026, personal profiles
Images dominate saves because they're easy to screenshot and reference. Documents are saved at 2.6x their share of total content, meaning people disproportionately save carousels compared to how often they appear.
If you're creating tactical content (frameworks, checklists, step-by-step processes), put it in a carousel format. It's the most save-worthy structure on the platform.
Tracking saves over time tells you which of your content has lasting value versus which generated a quick burst and faded. AuthoredUp's saved posts feature lets you see and organize everything you've bookmarked from your own feed too.
Follower Growth Rate: Are You Building or Stalling?
What it is: The net new followers gained over a period, usually tracked weekly or monthly.
Where to find it: LinkedIn profile → Analytics → Followers.
2026 context: Median follower counts in our dataset grew from about 5,500 to about 7,200 over 12 months for active profiles (March 2025–February 2026). That's roughly 2.7% monthly growth for profiles that post regularly.
The absolute number matters less than the trend. Flat follower growth despite consistent posting usually means:
- Your content reaches existing followers but doesn't break out of your network
- You're not posting formats that drive follows (documents and image posts drive more follows than text)
- Your profile isn't optimized for conversion. Someone reads your post, visits your profile, and doesn't see a reason to follow
For profile optimization tips, check our LinkedIn profile optimization guide.
Profile Views: Your Content's Second Effect
What it is: How many people visited your LinkedIn profile.
Where to find it: LinkedIn dashboard → "Who viewed your profile" (limited info for free accounts; full details with Premium).
Why it matters: Profile views are the bridge between content and action. Someone who views your profile after reading your post is considering you: as a connection, a client, a hire, a collaborator.
Track profile views alongside your posting activity. Spikes in profile views after specific posts tell you which content drives curiosity about you, not just about the topic.
A drop in profile views despite steady impressions means your content is getting seen but not creating enough intrigue to make people click through. Sharpen your hooks, add a personal angle, or include something unexpected that makes readers want to know who wrote it.
Dwell Time: The Metric You Can't See (But the Algorithm Can)
What it is: How long someone spends looking at your post in their feed before scrolling on.
Where to find it: LinkedIn doesn't show dwell time to creators. It's an internal algorithm signal only.
Why it matters: Dwell time is one of the strongest signals LinkedIn uses to decide whether to distribute your content further. A post that holds attention for 10+ seconds gets a distribution boost compared to one that gets scrolled past in two.
You can't measure dwell time directly, but you can optimize for it:
- Carousels generate the longest dwell time. Each swipe adds seconds. Our data shows documents have a 1.39x reach multiplier, partly driven by dwell time.
- Long text posts (1,000+ characters) generate 1.18x reach compared to short ones.
- Videos should capture attention in the first 2 seconds — if someone watches past that, dwell time climbs fast.
- Images with text keep people reading the image, adding dwell time beyond the caption.
For a data-backed look at which formats maximize dwell time, see best performing content on LinkedIn in 2026.
What About Reach vs. Impressions?
Reach (members reached) and impressions are different numbers:
- Impressions = total times your post appeared in feeds (one person can generate multiple impressions)
- Reach = unique people who saw it
LinkedIn shows impressions in post analytics but shows "members reached" in the overall dashboard. The gap between the two tells you how much repeat viewing your post gets, which is actually a positive signal. A post with 2,000 impressions and 1,200 reach means people came back to it (probably to read the comments).
For the full breakdown, our impressions vs views guide walks through every nuance.
LinkedIn Analytics for Company Pages
If you manage a company page, the metrics are the same but the benchmarks are different. Company pages get lower engagement rates across the board. This is normal, not a failure.
Company page benchmarks (2026):
Source: AuthoredUp analysis, Mar 2025–Feb 2026, company pages
Company pages also get unique metrics personal profiles don't:
- Visitor demographics: Who's landing on your page (industry, seniority, company size). Watch this for shifts in your audience composition.
- Follower analytics: Where your followers work, what level they're at. Critical for B2B targeting.
- Competitor benchmarks: LinkedIn lets you add competitors and compare follower growth and engagement. Check this monthly.
- Employee advocacy stats: How many employees are sharing your content and the reach that generates.
For the full employee advocacy playbook, see LinkedIn employee advocacy: everything you need to know.
Metrics That Don't Matter (Stop Tracking These)
Not every number LinkedIn shows you is useful. Here's what to ignore:
Connection count
A vanity metric. Someone with 500 engaged connections outperforms someone with 10,000 dormant ones. Focus on follower growth instead.
Post view count on articles
LinkedIn Articles get minimal feed distribution (0.69x reach multiplier in our data). Low view counts on articles don't mean your content is bad. It means the format doesn't get pushed.
Reshare counts
Reshares are the lowest-performing format (0.29x reach, 0.22x engagement). Getting reshared sounds good but generates almost no value. Getting commented on is worth 10x more.
SSI Score
LinkedIn's Social Selling Index is a black box that doesn't correlate strongly with content performance. It's useful for sales teams tracking prospecting activity, but for content creators it's a distraction. If you're curious, our SSI score guide explains what it actually measures.
How to Track LinkedIn Metrics Effectively
LinkedIn's native analytics are scattered across multiple sections and limited to recent data. Here's how to build a real tracking system:
1. Check post performance weekly, not daily
A post needs 48-72 hours for the algorithm to finish distributing it. Checking sooner gives you incomplete data.
2. Compare like with like
Don't compare a text post to a carousel. Track engagement rate by format separately to understand what's actually improving.
3. Build a monthly dashboard
Track: total impressions, average engagement rate, follower growth, profile views, and top 3 posts by engagement. Our guide on creating a LinkedIn analytics dashboard walks through this step by step.
4. Look at trends, not single posts
One viral post doesn't mean your strategy is working. One flop doesn't mean it's broken. Look at 4-week rolling averages.
5. Use historical data
AuthoredUp tracks your performance over months and years, including data going back before you started using the tool via LinkedIn archive import. Comparing your January 2026 engagement rate to January 2025 reveals seasonal patterns you'd otherwise miss.
What Is a Good Engagement Rate on LinkedIn in 2026?
A "good" rate depends on your follower count. The table above shows median rates by bracket, but here's how to interpret it:
- Above 3.5%: Strong. Your content consistently resonates.
- 2.5–3.5%: Healthy. You're performing at or above the platform median.
- 1.5–2.5%: Average for larger accounts (20K+), below average for smaller ones.
- Under 1.5%: Needs attention. Content isn't connecting with your audience.
The biggest lever for improving engagement rate isn't posting more. It's posting the right format. Documents generate 1.30x engagement, while text generates just 0.78x. Switching one text post per week to a document could move your rate measurably.
How Often Should You Post to Improve Your Metrics?
Source: AuthoredUp posting frequency analysis, personal profiles
The sweet spot is 4–5 posts per week: highest engagement rate and 28% more impressions per post than posting once weekly. Beyond 7 posts weekly, both metrics drop. Audience fatigue sets in.
80% of LinkedIn profiles post only once a week. If you can sustain 3–5 quality posts weekly, you're already outpacing the vast majority of the platform.
For a complete content strategy framework, including what formats to mix and when to post, start with our guide.
How Do I Know If My LinkedIn Content Strategy Is Working?
Don't evaluate your strategy on individual posts. Look at monthly trends across these four numbers:
- Average engagement rate (are people interacting more or less?)
- Follower growth rate (is your audience expanding?)
- Profile views per post (is content driving curiosity about you?)
- Post impressions trend (is your content reaching more people over time?)
If all four are flat or rising, your strategy is working. If impressions are up but engagement rate is down, you're reaching people who don't care. Tighten your targeting or sharpen your content. If engagement is up but impressions are flat, you're resonating with your existing audience but not growing. Experiment with formats that break out of your network (documents and posts with strong hooks).
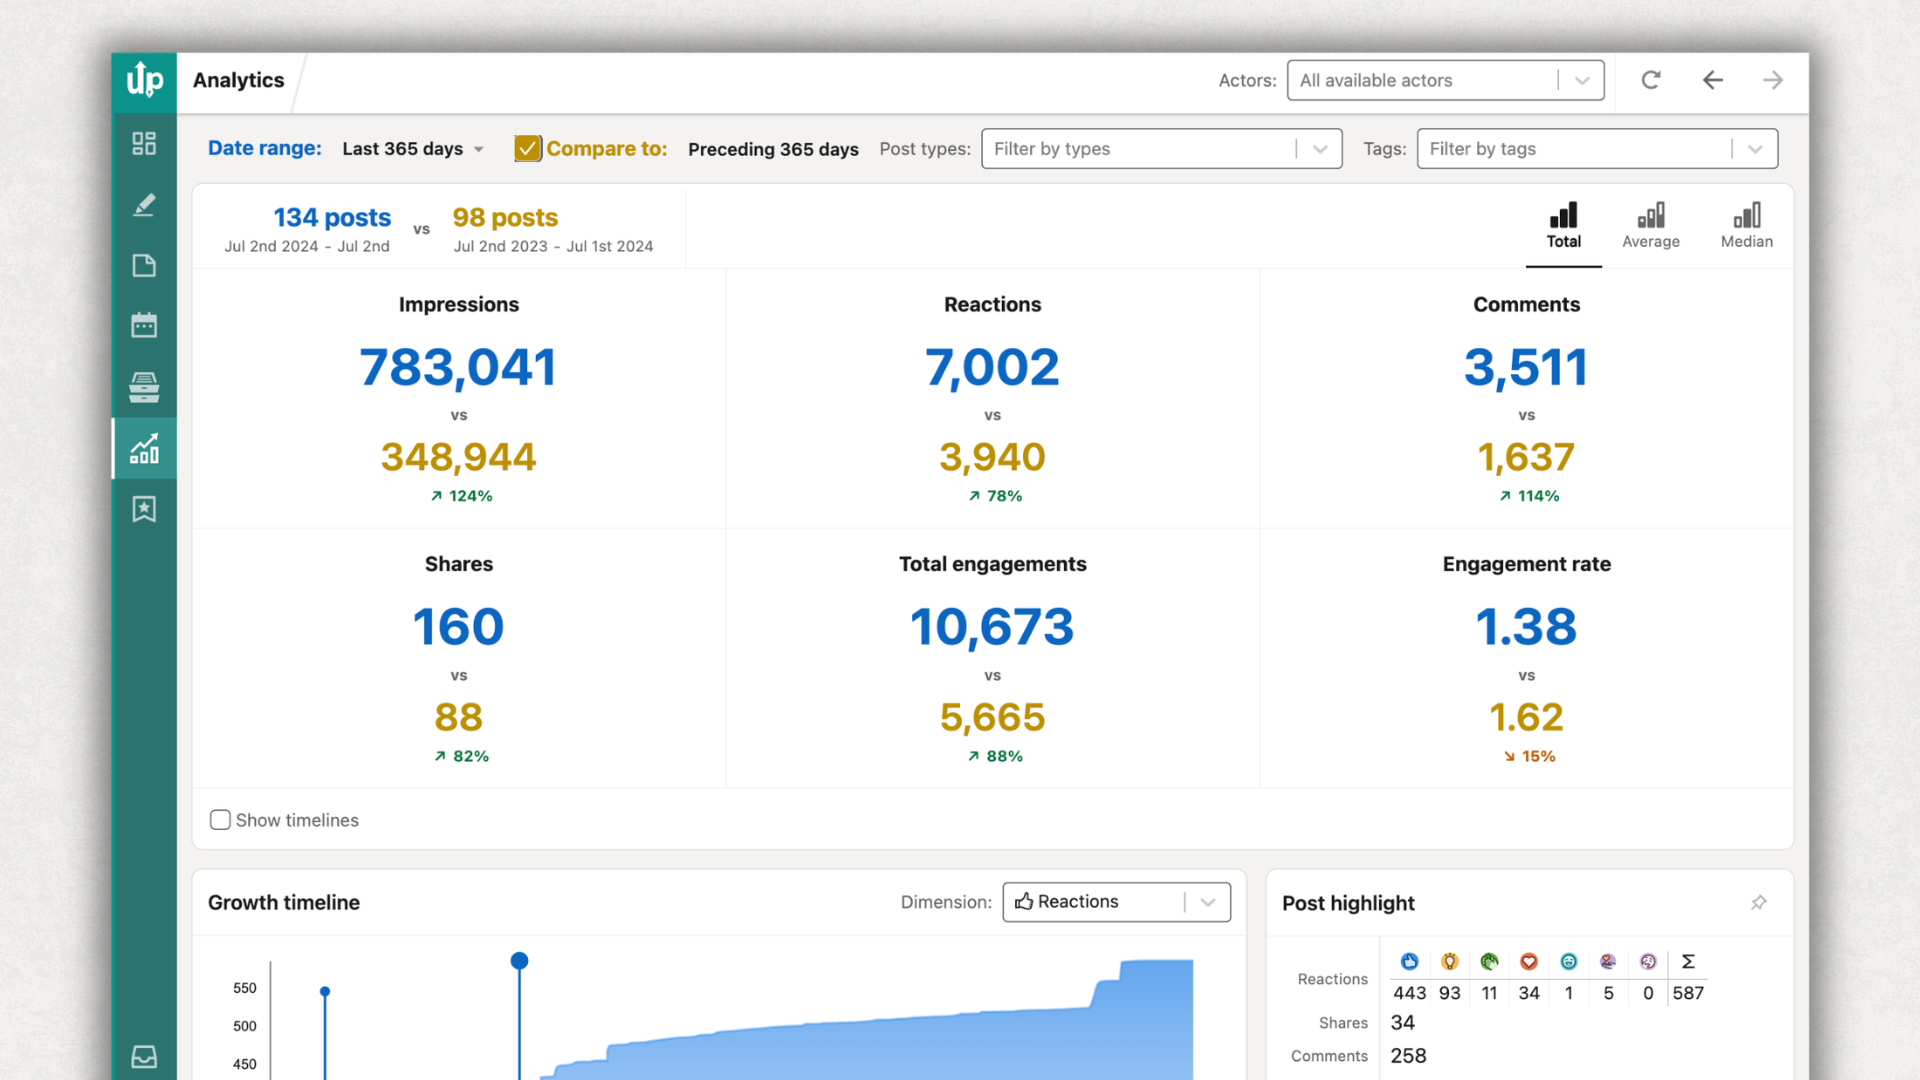
Use AuthoredUp's content analytics to track all four numbers in one dashboard, compare periods, and identify which posts move the needle.
FAQ
What LinkedIn metrics should I track as a beginner?
Start with three: impressions, engagement rate, and follower growth. Impressions tell you how many people see your content. Engagement rate tells you whether they care. Follower growth tells you whether you're building an audience over time. Once you're comfortable with those, add saves and profile views to the mix. Anything beyond that is noise for most creators.
How often should I check my LinkedIn analytics?
Weekly. A post needs 48-72 hours for the algorithm to finish distributing it, so checking daily gives you incomplete data. Review your numbers every Monday morning: look at last week's posts, note which formats and topics performed best, and adjust your plan for the week ahead.
Why are my LinkedIn impressions dropping?
Three common causes. (1) LinkedIn's algorithm updated, which happens regularly and affects everyone. Median impressions for top 5% profiles dropped 50% year-over-year in our data. (2) You changed something about your posting. Format, timing, frequency, or topic shifts all affect distribution. (3) Your content isn't generating enough early engagement. Posts that don't get comments in the first hour receive limited distribution. Check your engagement rate by format to see if a format switch could help.
What's the difference between LinkedIn analytics for profiles vs. company pages?
The core metrics are the same (impressions, engagement, followers), but the benchmarks differ significantly. Personal profiles get a median of 860 impressions per post compared to 500 for company pages. Company pages also get unique metrics personal profiles don't: visitor demographics, competitor benchmarking, and employee advocacy stats. Track both separately if you manage a page and a personal profile.
Can I see LinkedIn analytics for more than 365 days?
LinkedIn's native analytics are limited to the past year. For longer historical data, you need a third-party tool. AuthoredUp can import your full LinkedIn post history via the GDPR data export (your LinkedIn archive), giving you analytics going back years. This is useful for spotting seasonal patterns and long-term trends that a 12-month window can't show.
Does engagement rate matter more than total impressions?
Yes, for most creators. A post with 500 impressions and a 5% engagement rate (25 interactions) is more valuable than a post with 5,000 impressions and a 0.3% engagement rate (15 interactions). High impressions with low engagement means you're reaching people who scroll past. High engagement rate means your content resonates. The exception: if you're running brand awareness campaigns where raw visibility matters more than interaction.
.png)
.png)
.png)
