


.svg)

.png)
Most LinkedIn writing advice was written once, in about 2019, and has been copied sideways ever since. Ask three tools how to write a post and you get the same ten tips back: hook them with a question, add three hashtags, post at 9am on Tuesday.
We have the data to check that, so we did.
This is built on 771,211 posts from personal profiles with at least 100 impressions, July 2025 through June 2026, plus a 1.3 million post study we contribute research to. Some of the standard advice holds up. Three pieces of it are now actively wrong, and one of those three will cost you reach every time you follow it.
Before the tips, one number worth having in your head: the typical LinkedIn post gets 634 impressions. Not 10,000. If you have been judging your posts against the viral ones in your feed, you have been comparing yourself to the top 5%, which starts at 18,171 impressions. A 600-impression post is not a failure. It is the middle of the distribution.
How to write a LinkedIn post that gets read
The short version, in the order the decisions actually matter:
- Open with a short first line. Under 40 characters performs best.
- Tell a story rather than asking a question. Story hooks beat question hooks by 20%.
- Write more than 100 words. Under 100 is the weakest bucket on every format, and past that there is no universal best length.
- One idea per line, with blank lines between them.
- Use bold sparingly, for the two or three phrases that carry the point.
- Add at least one emoji. Going from zero to one is the entire gain.
- Attach an image. Image posts beat every other format on engagement in every account size we measured.
- Tag people only when they have a real reason to reply.
- Skip the hashtags. Posts without them now outperform posts with them.
- Post four to five times a week. Frequency matters more than the hour you pick.
The rest of this post is why, and what the numbers behind each one look like.
1. Write a shorter first line than you think you need
The first line is the only part of your post that is guaranteed to be seen. Everything after it is behind a "see more" click.
Hook length maps onto engagement almost perfectly, and it only goes one direction:
Every step up in length costs you engagement. The shortest bucket beats the longest by 25%.
Most people write a first line that explains what the post is about. A short line does not have to explain anything. It has to make the next line worth opening.
If you want examples of openers that hold up, we keep a set in our LinkedIn hook examples.
2. Tell a story, do not ask a question
This is the first piece of standard advice the data contradicts. "Open with a thought-provoking question" is on every LinkedIn tips list, including the version of this page it replaces.
Question hooks are the worst-performing style we measured:
Story beats question by 20%. Our best guess at why: a rhetorical question asks the reader to do work before they have any reason to care, and the obvious answer to most of them is "no."
A closing question is a different thing and does help slightly. Posts ending in a question run 2.33% against 2.26% for posts that do not. Small, but it points the right way.
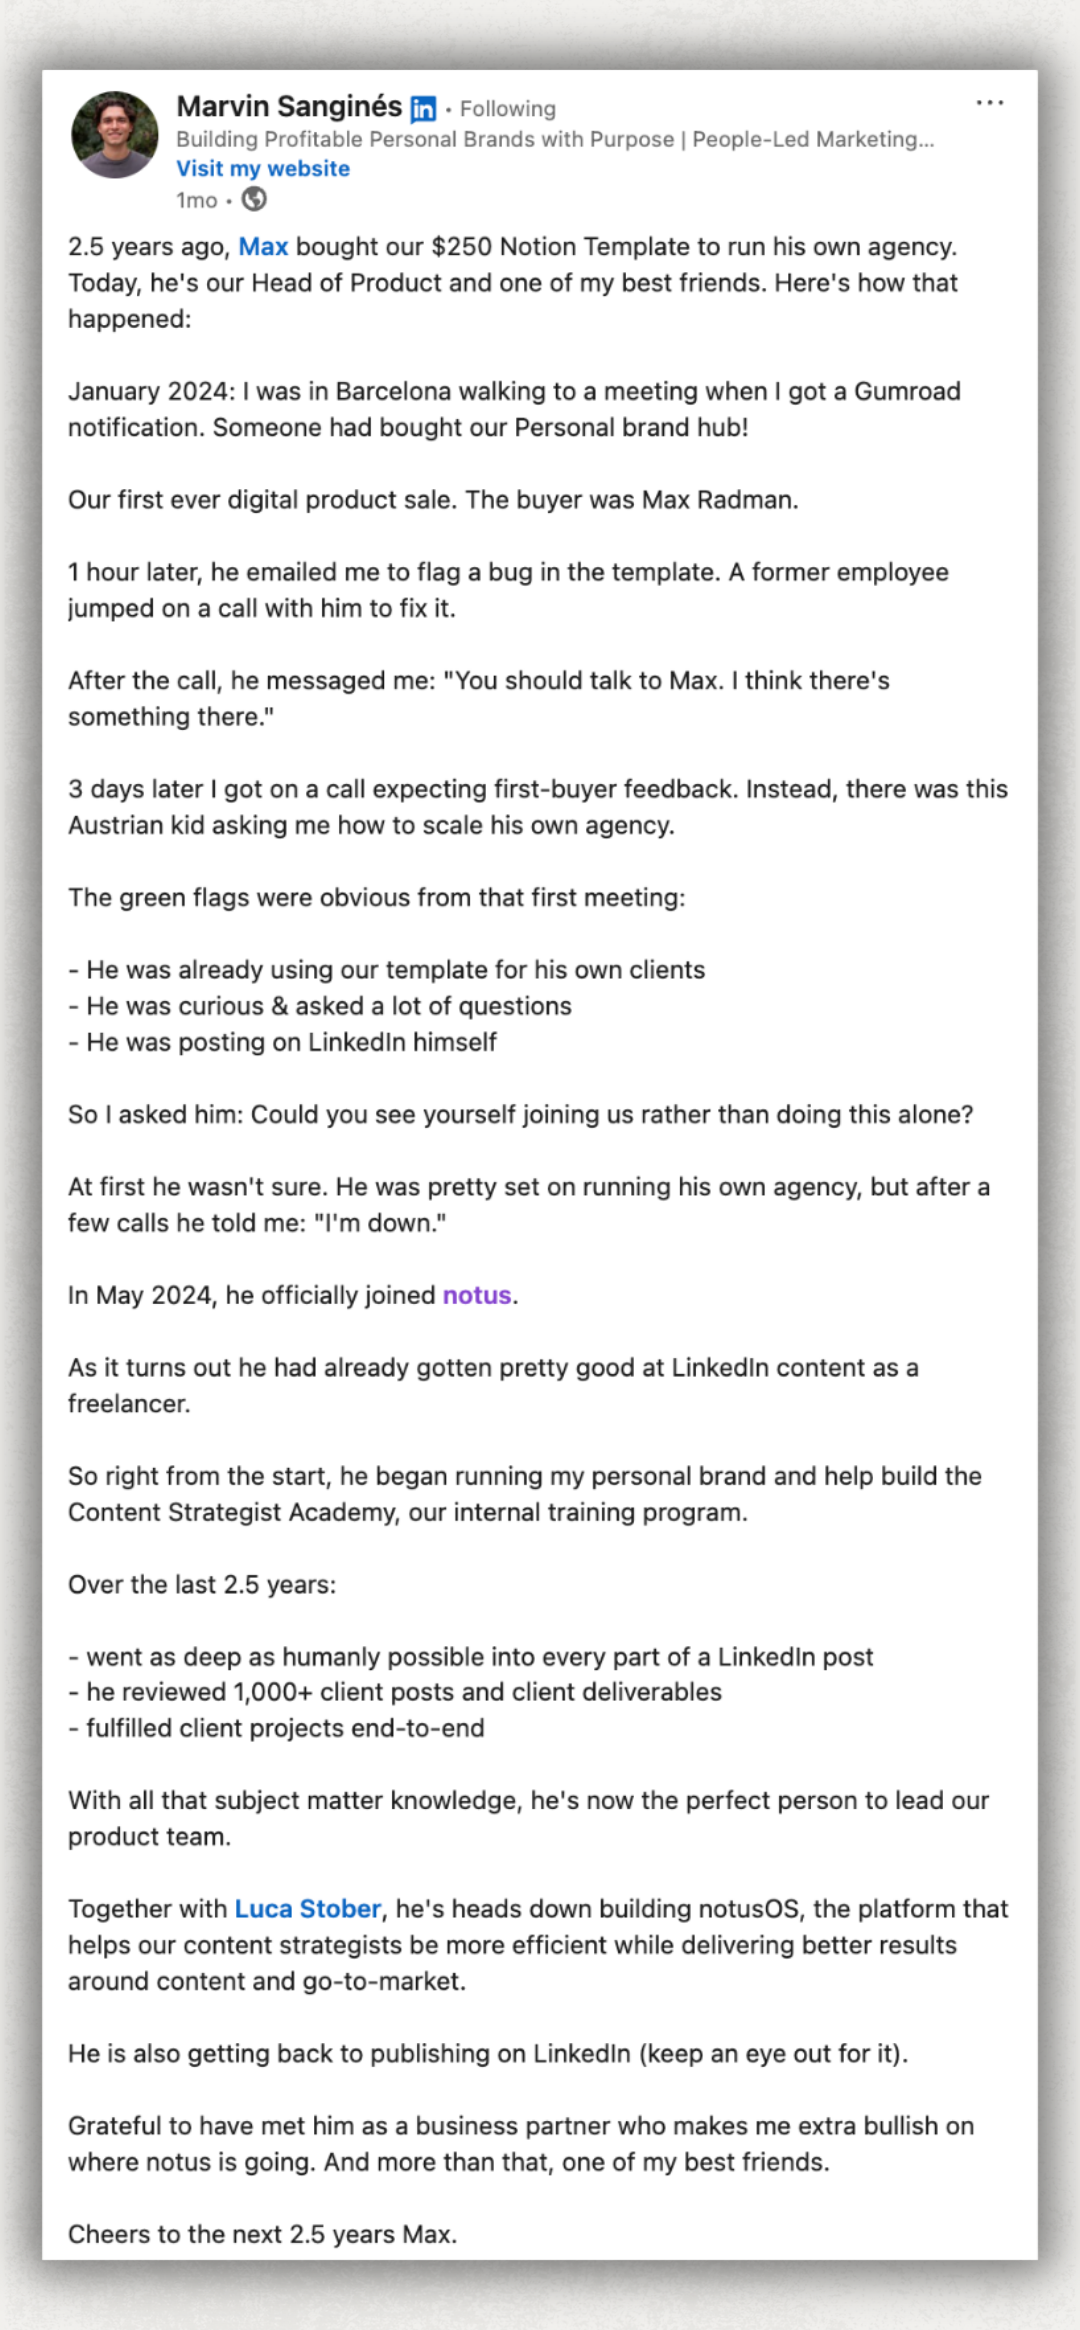
Marvin Sanginés opens a post about hiring his Head of Product like this: "2.5 years ago, Max bought our $250 Notion Template to run his own agency. Today, he's our Head of Product and one of my best friends. Here's how that happened:"
Look at what that does before it asks anything of you. It names a date, a price and a person, then puts the ending next to the beginning and leaves the middle out. The reader is not being asked to consider anything. They are being told a gap exists, and the only way to close it is to keep reading.
A question hook does the reverse. It opens with a demand, and the reader can settle it in one word without scrolling.
3. Write more than 100 words
The old advice on this page said "around 10 paragraphs." The usual length advice is wrong, and it is wrong in the same direction every time. Too short.
Longer posts beat shorter ones on every format we measured. This is engagement against the median post of the same format:
Four formats, same direction, no exceptions. Posts under 100 words are the weakest bucket everywhere. Polls follow the same pattern but their long buckets get thin, so they are left out of the table.
That table has a confound in it worth naming, because it changes what you should do with it.
Bigger accounts write longer posts. In the image rows, median followers climbs from 5,927 in the under-100 bucket to 8,297 in the 400+ bucket. So some of that rise is audience size rather than length doing the work.
The benchmark carries a creator-neutral reach index that strips this out. It compares each post against what its own author normally gets, so a long post by a big account no longer counts as evidence that long posts travel. Read the same data that way and the advantage mostly evaporates:
Roughly six characters per word including spaces, so 1,000 characters is about 165 words.
Every format's raw peak sits at the long end. Every format's creator-neutral peak sits nearer the middle, and no two formats agree on where. That is the finding: there is no single winning length, because the number moves depending on what you attach to it.
The size of the effect matters more than its direction. Across all 43 reliable character buckets in the dataset, the creator-neutral index runs from 85.6 to 107.5. One bucket accounts for most of that range, text-only posts under 400 characters at 85.6. Take that one out and nearly everything else sits within a few points of average.
So length has one real cliff and no real summit. Clear the cliff, then spend the attention you were giving to word count on the first line and the format instead.
Paragraph counts point the same way. Posts running past 20 paragraphs beat their format median on engagement, at 1.27x for images and 1.21x for text-only, while the 0 to 5 paragraph bucket is the weakest on every format. "Around 10 paragraphs" sits just below the point where the numbers turn positive.
So: one idea per line, and more lines than feels natural.
4. Break the text up
This one survives the data check, and it is the least surprising thing on the list. People scan before they read, and on LinkedIn they are mostly doing it on a phone between other things. Nielsen Norman Group has documented the scanning pattern across two decades of eye-tracking, and a wall of text is what it fails against.
One idea per line. A blank line between lines. That is most of it, and it matches what NN/g found about how people read online: they scan for the parts that look like they carry the point, and skip the rest.
The thing people get wrong is checking. LinkedIn's composer does not show you what the post looks like in the feed, where line breaks land differently and the "see more" cut falls in a place you did not choose. Run it through the free LinkedIn post preview generator before you publish, or use AuthoredUp's preview to see desktop and mobile side by side.
Posts scoring under 4 on our readability check are the strongest bucket on every format, and it falls away steadily from there. At a score of 10 or above, image posts run 0.84x reach and 0.70x engagement against their format median.
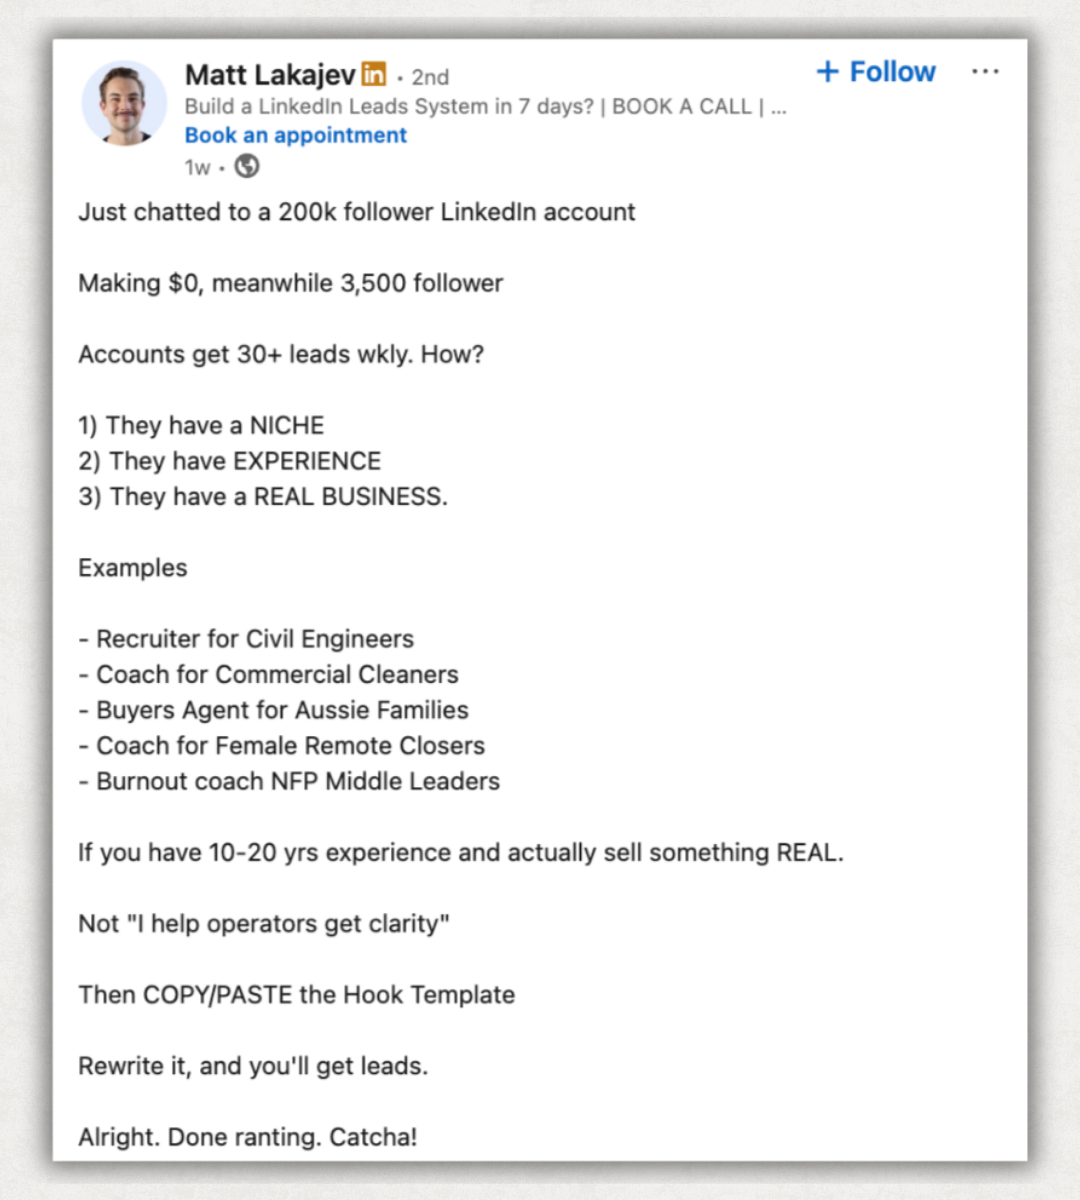
Matt Lakajev's post below argues that a 200,000-follower account can earn nothing while 3,500-follower accounts pull 30 leads a week. The numbers in it are his, not ours. What is worth copying is the layout. 95 words across 17 lines, grouped into 11 blocks with a blank line between each. No line runs past 12 words and the average is under six. Three reasons, a line each. Five examples, a line each. Nothing shares a line with anything else.
On a phone that means there is no paragraph to get lost inside, because there are no paragraphs. There are only lines.
5. Use bold for two or three phrases, not ten
LinkedIn has no formatting toolbar, so bold and italic text is done with Unicode character substitution. That has a cost worth knowing: screen readers announce those characters as individual symbols rather than words, so a post written entirely in bold is unreadable to anyone using one.
Two or three bolded phrases mark the points you want someone to catch while scanning. A whole bolded paragraph marks nothing.
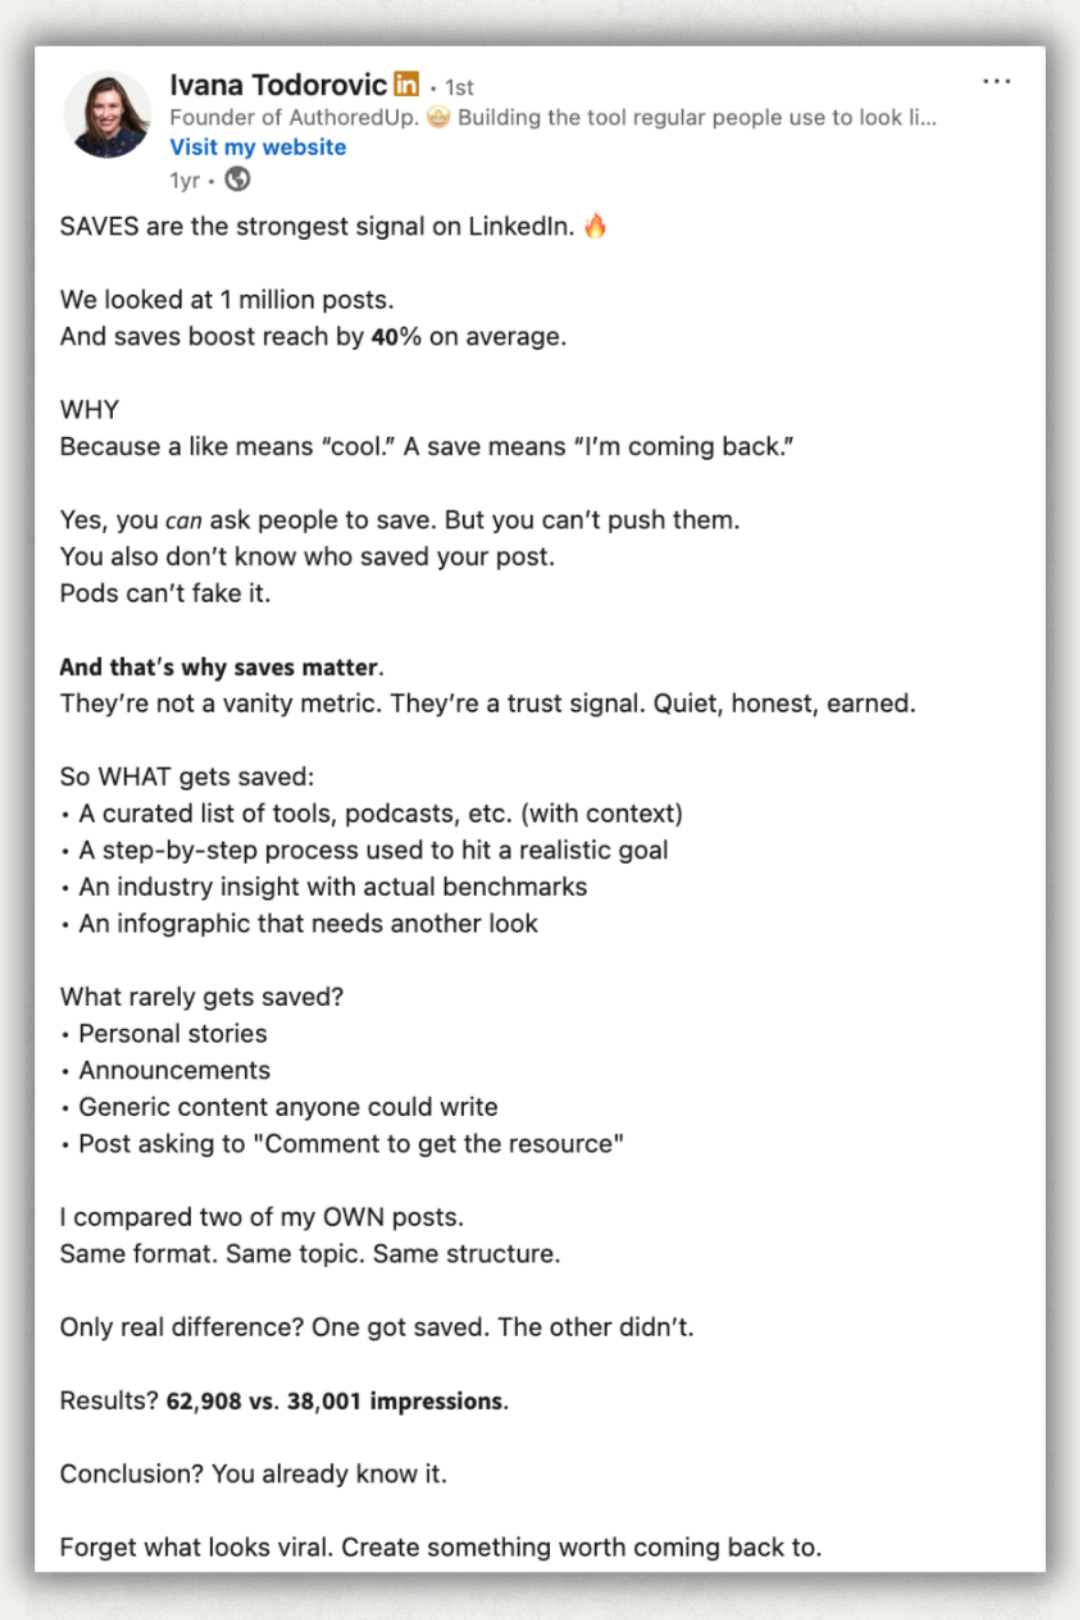
Here is one of Ivana's posts doing it. Three phrases are bold and nothing else is: the 40% figure, the one line the argument turns on, and the two numbers at the end. Scanning it without reading, you land on a number, a claim and a result, which is the whole post in three stops. A fourth bold would have cost one of those three its weight.
You can format it in the free LinkedIn text formatter, which handles bold, italic, and lists without breaking the characters. If you want the longer version on what formatting does and does not do, we wrote it up in LinkedIn text formatting and bullet points in LinkedIn posts.
6. Add one emoji, then stop counting
The old advice was "limit yourself to 10 emojis." That frames the risk as using too many. The data says the risk is using none.
The entire effect is in the first one. Going from zero to one emoji is worth 22% more reach. Going from one to ten is worth almost nothing, and the curve is flat the rest of the way out.
Nearly half of all posts (47%) use no emoji at all, which makes this the cheapest change on this list.
Read it as association rather than cause. People who reach for an emoji are probably writing differently in other ways too. But the size of the zero-to-one step, across 397,189 posts with none, is hard to explain away entirely.
7. Attach an image
Image posts beat every other format on engagement, in every account size we measured. The multiplier is against the median post in that same follower band:
Three things worth pulling out of that table.
Text-only posts are the weak format, not the safe one. They run 25% to 45% below the median across every band.
Video underperforms on engagement everywhere, which is not what the platform's own promotion of it would suggest.
Polls are the worst engagement format in the data by a wide margin, and they get worse as accounts grow. They do pick up reach at larger account sizes, so if reach is the only thing you want they are defensible. As a way to start a conversation they are not.
Documents are the one format that changes rank with account size. Below 5,000 followers they are unremarkable. At 20,000-plus they match images. If you are large enough for carousel posts to be worth the production time, that is where it starts.
8. Tag people who have a reason to reply
Tagging works when the tagged person answers, and works against you when they do not. LinkedIn reads a tag that gets no response as a weak signal about the post.
So the test is not "would this person find it interesting." It is "will this person see the notification and reply today." Usually that means someone quoted in the post, someone whose work it builds on, or someone directly involved in what you are describing.
Three or four tags of people who reply beat fifteen who do not. The mechanics are in our guide on how to tag people in a LinkedIn post.
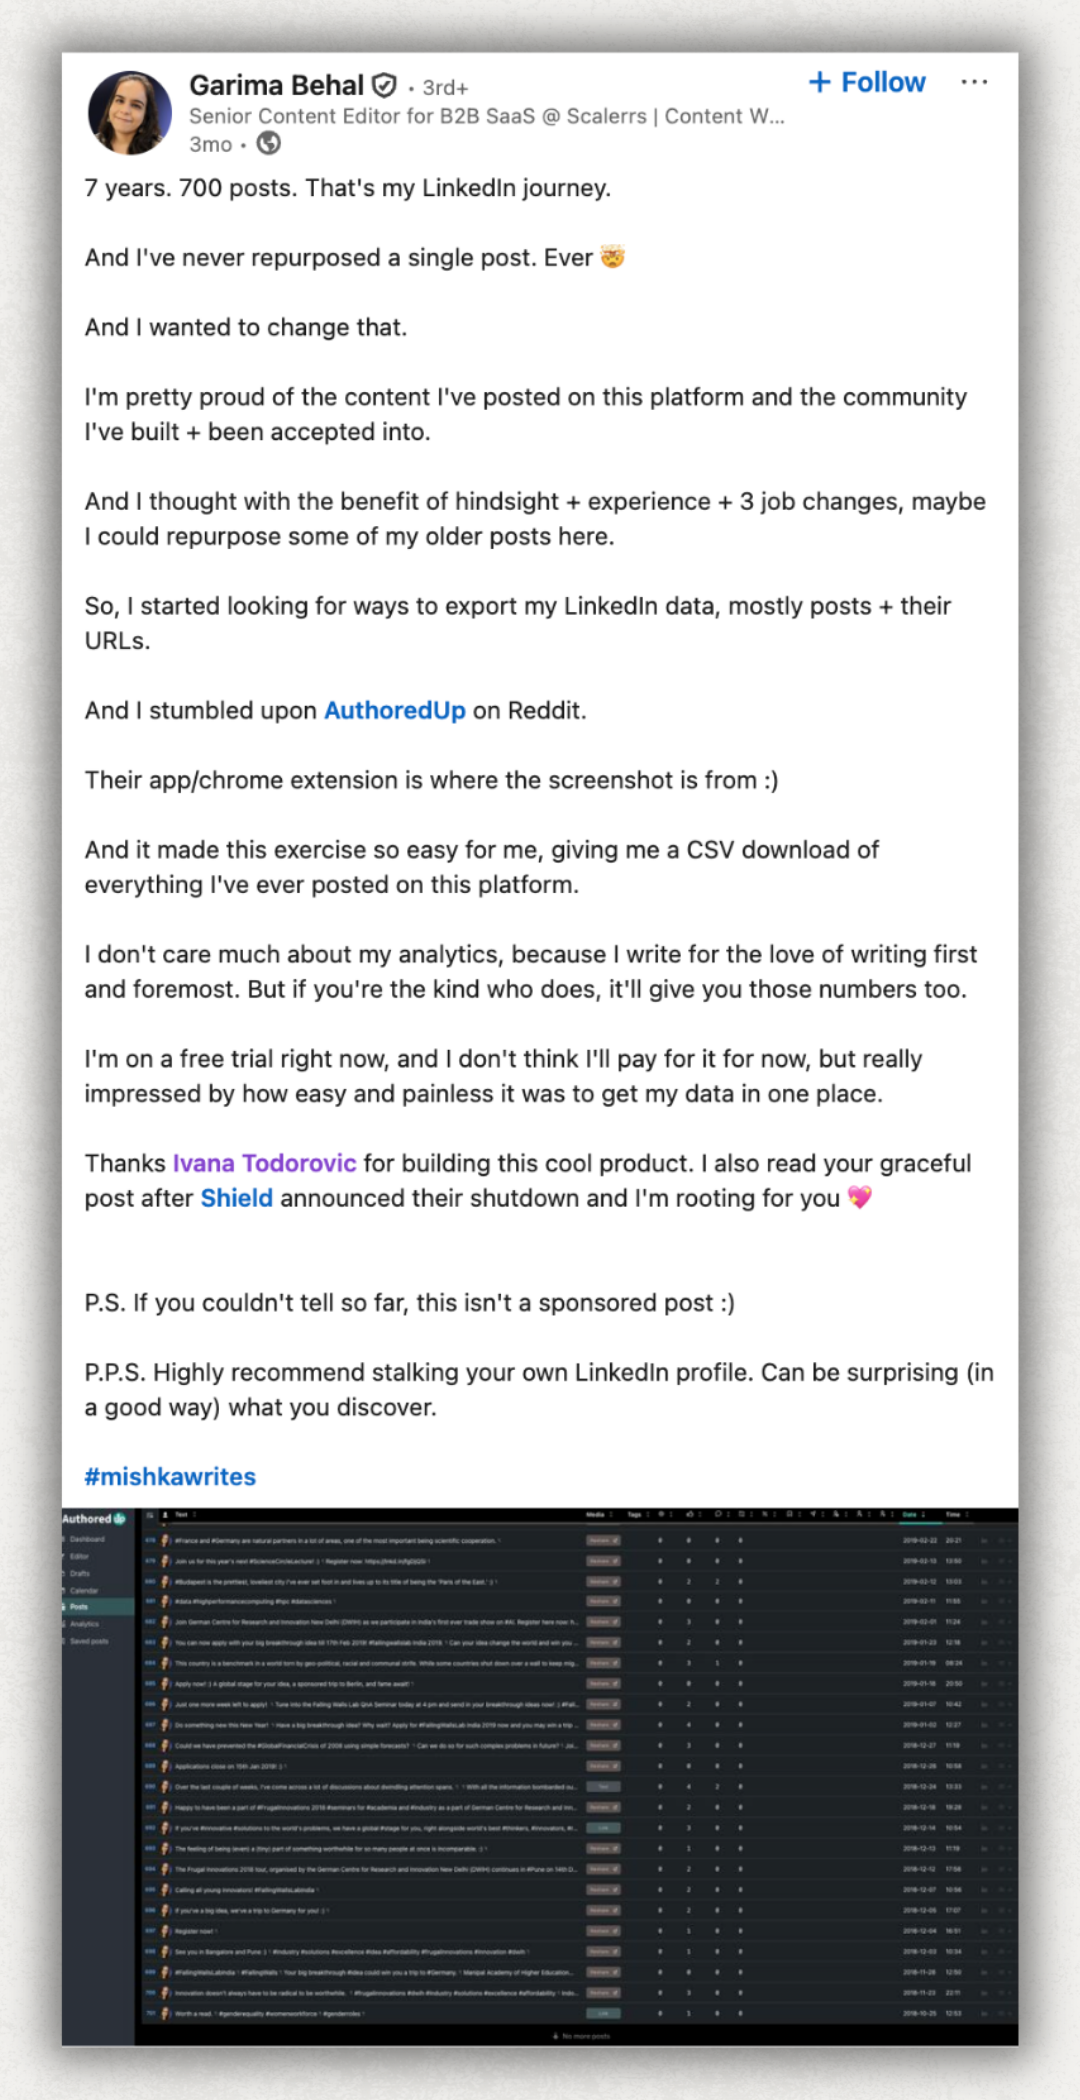
Garima Behal's post is a clean example of the test being met. She writes about exporting seven years of her own LinkedIn posts, names the tool she used, and tags the person who built it. That tag is not decoration. It goes to someone with an obvious reason to see it and reply, in a post where the mention is the actual subject rather than an afterthought.
Compare that to tagging ten people who appear nowhere in the post. The first earns a reply. The second earns a notification someone dismisses.
9. Stop using hashtags
This is the tip that has inverted since this page was first written, and it is the one still costing people reach.
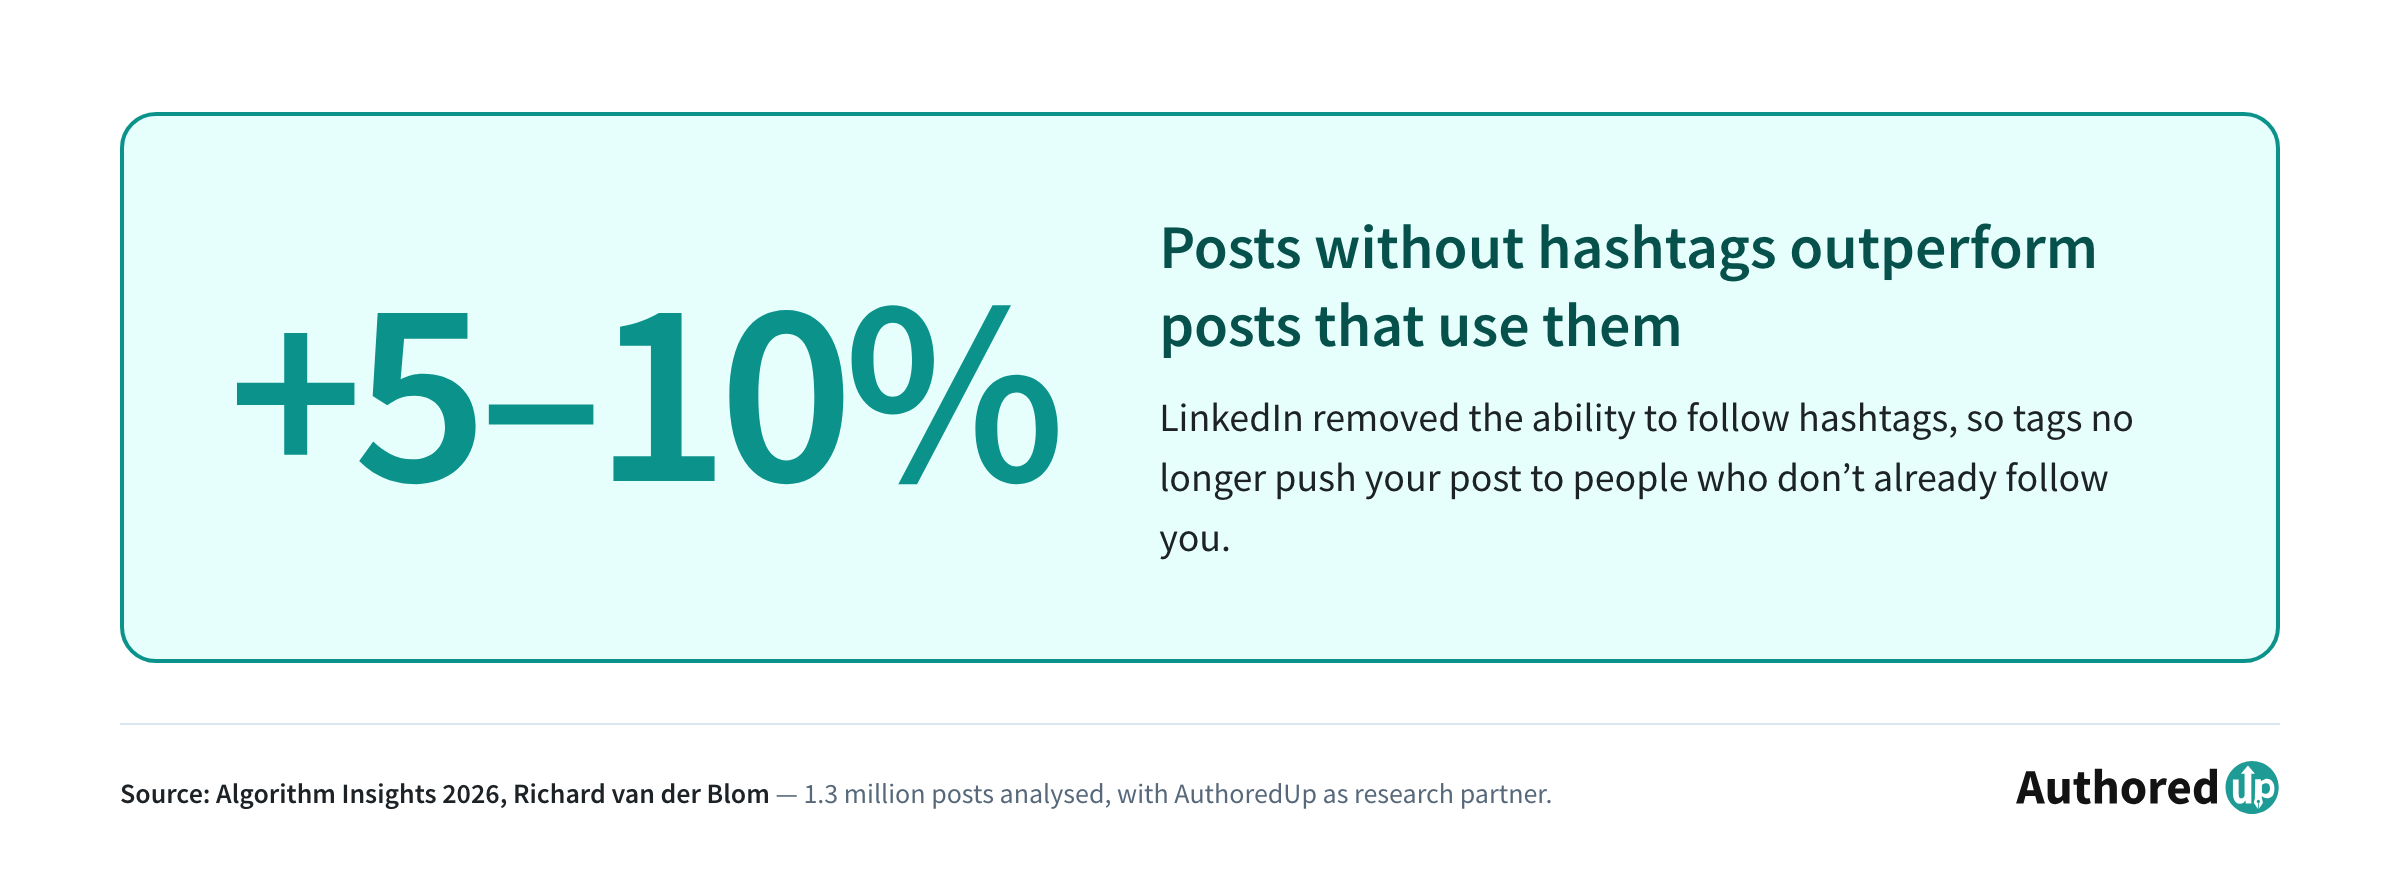
Posts without hashtags outperform posts with them by 5 to 10%.
That comes from the Algorithm Insights study, 1.3 million posts analysed, which we contribute data to as a research partner.
The mechanism is simple enough. Hashtags used to be a distribution channel: people followed them, and a tag put your post in front of an audience that had not followed you. LinkedIn removed hashtag following in late 2024. It also dropped hashtags from profile displays and stopped suggesting them in the composer.
So the channel they existed to reach is gone, and what remains is three lines of blue text at the bottom of your post that read as marketing and give the algorithm nothing it cannot already work out from your words.
If you are tracking hashtag performance out of habit, our post on LinkedIn hashtag analytics explains what those numbers can and cannot tell you now.
10. Post four to five times a week
Timing advice is the most repeated and the least useful thing on lists like this one. "Post at 9am on Tuesday" assumes your audience sits in one timezone and behaves like everyone else's.
How often you post matters more than when:
Four to five is the peak on engagement, and 28% more reach per post than posting once. Then it breaks. At eight or more per week both numbers fall below where a once-a-week poster lands, so the ceiling is real and it is not far above the peak.
Note that 79.8% of profiles post once a week or less. Moving to three or four is a bigger change than any individual tip on this page.
Frequency matters most while your account is small. Below 5,000 followers, accounts posting six or more times a month grew several times faster than accounts posting once. Above 5,000, that advantage disappears and everyone lands in the same 19% to 28% range regardless of volume.
For the timing question, the honest answer is that it depends on your audience, which is why we built the best times to post tool to work it out from your own analytics rather than from a global average.
What "results" actually means
Most of the tips above are scored on engagement rate, because that is what the data supports. It is also the metric most likely to mislead you when you look at your own posts.
Engagement rate falls as reach grows. That is not a failure, it is the mechanism:
A post that breaks out gets pushed past the people who already follow you to people who do not know you. Colder audiences react less. So if your engagement rate drops on a post that reached further than usual, you won.
The number worth watching instead is profile views. 79% of posts produce at least one, roughly one for every 325 impressions, and it is the step where someone stops, reads, and goes to find out who wrote it. If you sell anything, that is closer to the outcome you want than either reach or engagement rate.
One more, because it causes real confusion: the "followers gained" figure on each post only counts people who hit follow from the feed without opening your profile. That is about 0.3 followers on a median post, while the same accounts gained 16 to 22 per post over a year. The metric is not wrong, it is narrow. Do not read it as evidence your content is not growing an audience.
You can check any single post against the bands above with our free engagement rate calculator, or read the fuller set in LinkedIn post statistics.
Where to start
If you want one change rather than ten, cut the hashtags and shorten your first line. Those are the two with the clearest evidence behind them, and both take under a minute.
If you want a second, post more often. Four to five times a week is where the numbers peak, and four out of five people on LinkedIn are posting once or less.
Writing the post is the part no tool does for you. What AuthoredUp handles is everything around it: formatting that does not break, a preview of how it lands on both desktop and mobile, and analytics that tell you which hooks worked so the next one is not a guess. There is a 14-day free trial if you want to try it against your own posts.
FAQ
How often should I post on LinkedIn?
Four to five times a week is where engagement rate and reach per post both peak in our data, at 2.60% and 870 median impressions. Two to three is close behind and more sustainable for most people. Eight or more per week is counterproductive: both engagement and reach fall below what a once-a-week poster gets. More detail in how often to post on LinkedIn.
How many hashtags should I use on LinkedIn?
None. Posts without hashtags outperform posts with them by 5 to 10%. LinkedIn removed hashtag following in late 2024, so tags no longer put your post in front of people who do not already follow you.
How long should a LinkedIn post be?
Long enough to clear the short end, and after that there is no universal right answer. Posts under 100 words are the weakest bucket on every format, at 0.72x to 0.79x their format's median engagement, and text-only posts under 400 characters are the single worst bucket in the dataset. Raw numbers keep rising past that, but almost all of the rise is larger accounts writing longer posts. Measured creator-neutrally, every format peaks somewhere in the middle and no two formats peak in the same place. Keep the first line under 40 characters regardless of total length, since that line is doing a different job.
What type of post gets the most engagement?
Image posts, in every account size we measured, at roughly 1.16x to 1.18x the median. Text-only posts run 25% to 45% below. Polls are the weakest format for engagement by a wide margin.
Why did my engagement rate drop on a post that reached more people?
Because that is what expanding reach does. Viral posts average 0.87% engagement against 2.84% for typical posts. Reaching past your warm audience means reaching people less likely to react. A falling engagement rate on a rising-reach post is a good sign, not a bad one.
Do links in the post body reduce reach?
This is the most widely repeated rule on LinkedIn and we have not tested it on our own data yet, so we are not going to assert it either way. Putting the link in the first comment costs you nothing if you want to be cautious, but treat "links kill reach" as an untested belief rather than a finding.
How do I measure whether a post worked?
Watch profile views rather than followers gained. 79% of posts produce at least one profile view, about one per 325 impressions, and that is the step where people actually decide to follow you or look at what you sell. The per-post "followers gained" number only counts follows that happened without leaving the feed, which is roughly 0.3 per post.

.svg)
.png)

.svg)
.png)
.png)