


LinkedIn Company Page Benchmark
Free tool to see how your LinkedIn company page post actually performed. Enter the post's impressions, reactions, comments, and reposts, and see where its engagement rate lands among 190,000+ real company-page posts.
One post tells you one thing.
Your page tells you the pattern.
.svg)
Frequently asked questions
What is AuthoredUp?
AuthoredUp is an all-in-one app for content creation on LinkedIn, available as a Chrome extension and web platform. It is crafted for everyone eager to sharpen their personal brand, not just professional copywriters. And the best thing, it is not taking a cookie or doing automation on LinkedIn.
AuthoredUp supports both personal profiles and company pages. Interested? Sign up here and begin with a 14-day free trial, no credit card necessary.
How to use this company page benchmark tool?
Open your company page analytics, pick a post, and copy four numbers into the tool: impressions, reactions, comments, and reposts. The tool calculates your engagement rate using the formula (Reactions + Comments + Reposts) / Impressions x 100, then places it among company-page posts that got similar reach, so you get your percentile and your quartile rather than a number with nothing to compare it to. Add your follower count from the dropdown for a second comparison against pages of a similar size. You can also enter your recent averages instead of a single post if you want a read on the page as a whole.
Is this tool free?
Yes, completely free. No account needed, no limits on how many times you use it. Everything runs in your browser, and we don't collect or store the numbers you enter.
What is a good engagement rate for a LinkedIn company page?
The median company-page post gets 2.59%, and the top quarter starts at 3.79%. But that headline number hides the thing that actually decides your result, which is reach. Posts that reached 100–500 people have a 3.15% median, 501–1,000 sits at 2.72%, 1,001–5,000 at 2.29%, and above 5,000 impressions it falls to 1.47%. Engagement rate has impressions in the denominator, and reach grows faster than engagement does, so the same 2.5% is a below-average result on a post seen by 400 people and an excellent one on a post seen by 8,000. That's why this tool compares you against posts with similar reach instead of one flat number. These benchmarks come from AuthoredUp's analysis of 190,000+ company-page posts published between July 2025 and June 2026.
Do LinkedIn company pages get less engagement than personal profiles?
Not at the median, which surprises most people. Across 190,000+ company-page posts and 700,000+ personal-profile posts, the typical company post gets 2.59% engagement and the typical personal post gets 2.36%, so the page wins the middle of the distribution. Profiles pull ahead at the top instead: their 75th percentile is 3.85% against 3.79% for pages, and their 90th percentile is 5.77% against 5.23%. The best personal posts beat the best company posts by a clear margin, while the average company post quietly does better than the average personal post. So the advice that company pages are dead is wrong about typical performance and right about the ceiling, and if your page sits near the median you're doing fine, with the room to grow at the top end.
Where do I find my company page's impressions, reactions, comments, and reposts?
Go to your company page, switch to admin view, then open Analytics and the Content tab. You'll see impressions and engagement for each post, and clicking an individual post breaks it down into reactions, comments, and reposts. Only page admins can see this, and LinkedIn keeps the data for the last 365 days.
My post landed in the bottom quarter. What should I fix?
A bottom-quarter result with normal reach means the post got seen and didn't earn a response, so the problem is in the post, not the benchmark. Two things move the number more than anything else: the first two lines, which decide whether anyone stops scrolling, and asking for something specific instead of ending on a statement. Comments and reposts also count the same as reactions in the formula while being much rarer, so a post that starts a real conversation moves your rate far more than one that collects likes. Before you rewrite anything, check the reach band, because one quiet post inside a good month is noise. Our guide to LinkedIn company page best practices covers the formats that hold up over a full quarter.
Other free tools
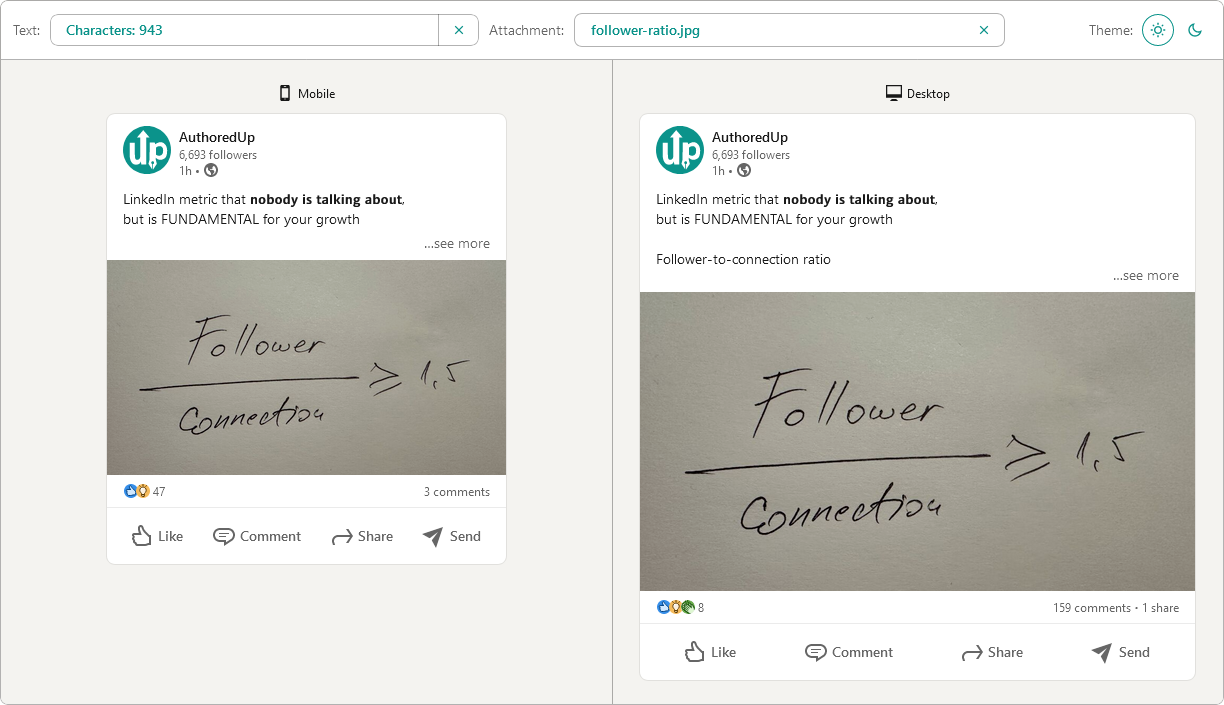
Post preview generator
Paste the text, choose the post type and see how it will look on desktop and mobile screen.


Text staircase tool
Free tool to help you reorder your LinkedIn content, and stand out in the feed.
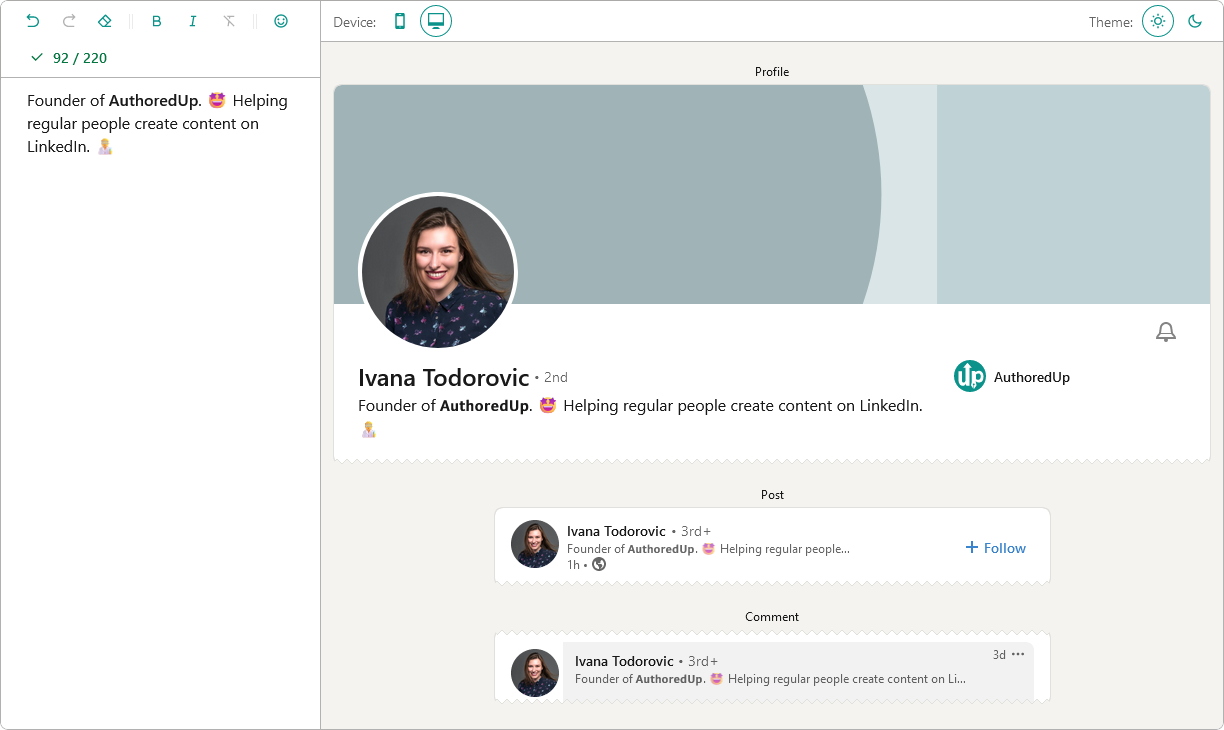
LinkedIn headline writer
Optimize your LinkedIn headline to stand out in the feed. Turn lurkers into visitors, and visitors into leads.
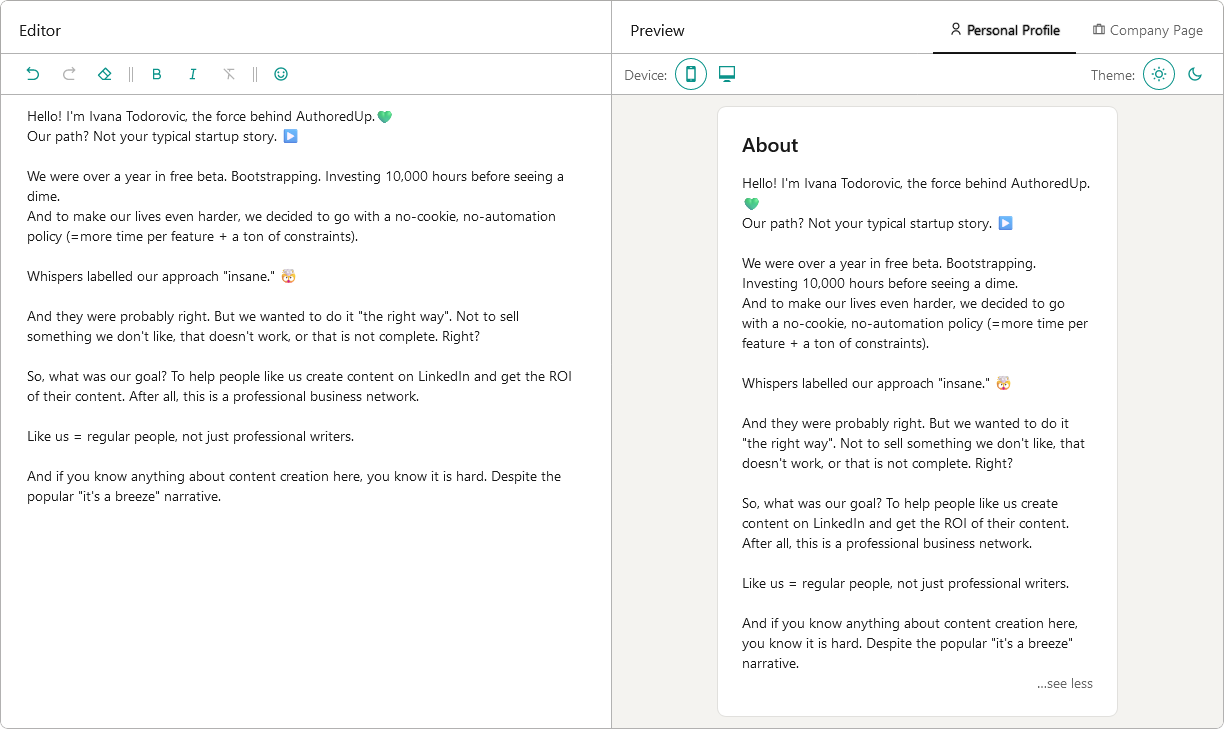
About me writer tool
Free tool to write, edit and preview About me section and Company page description on LinkedIn™.
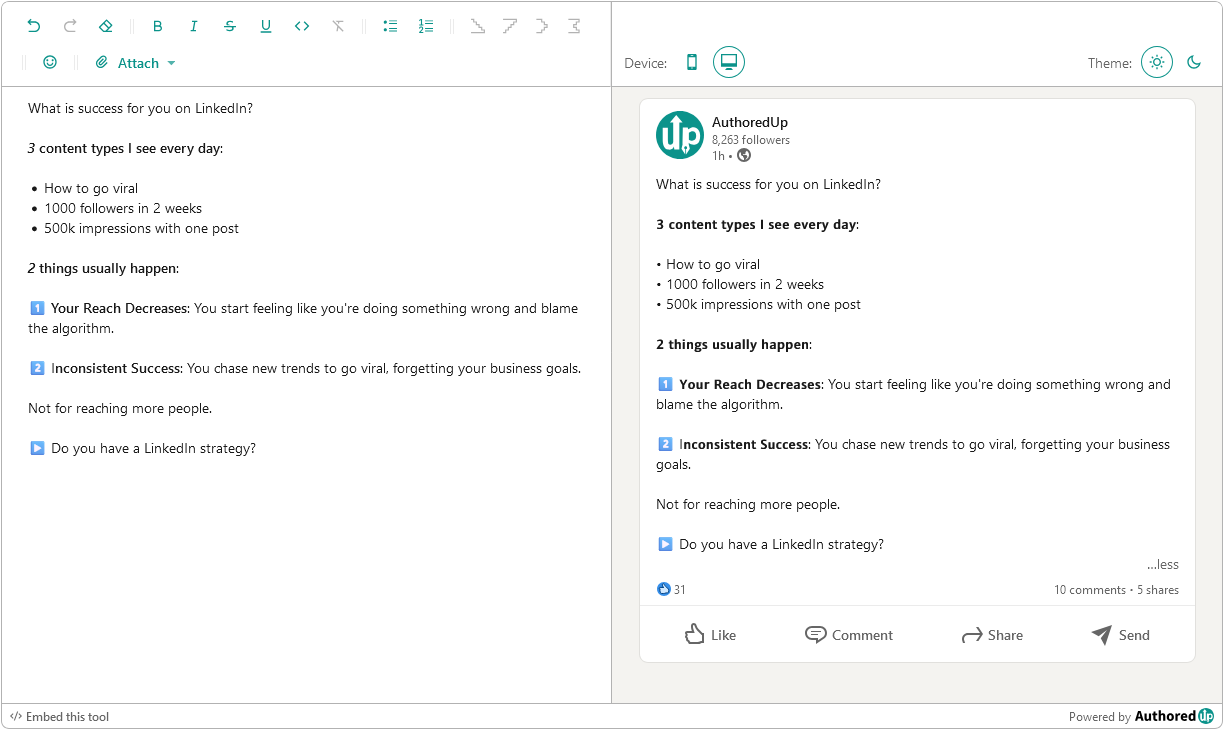
LinkedIn Text Formatter
Transform your posts using various formatting styles like bold, italic, bullet points, and numbered lists with this free tool.
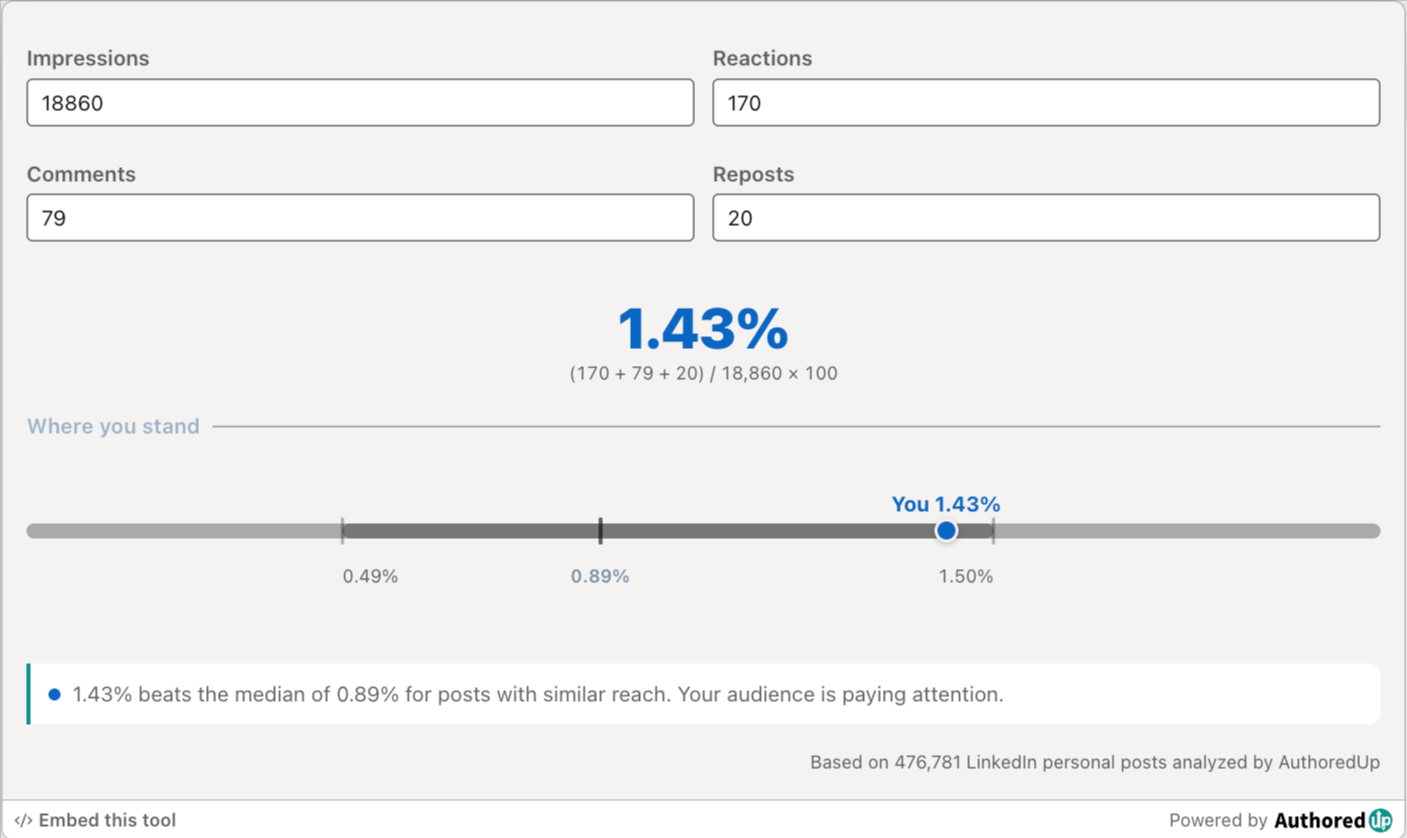
LinkedIn engagement rate calculator
Enter your post stats and see your LinkedIn engagement rate, plus how it compares to real benchmarks.
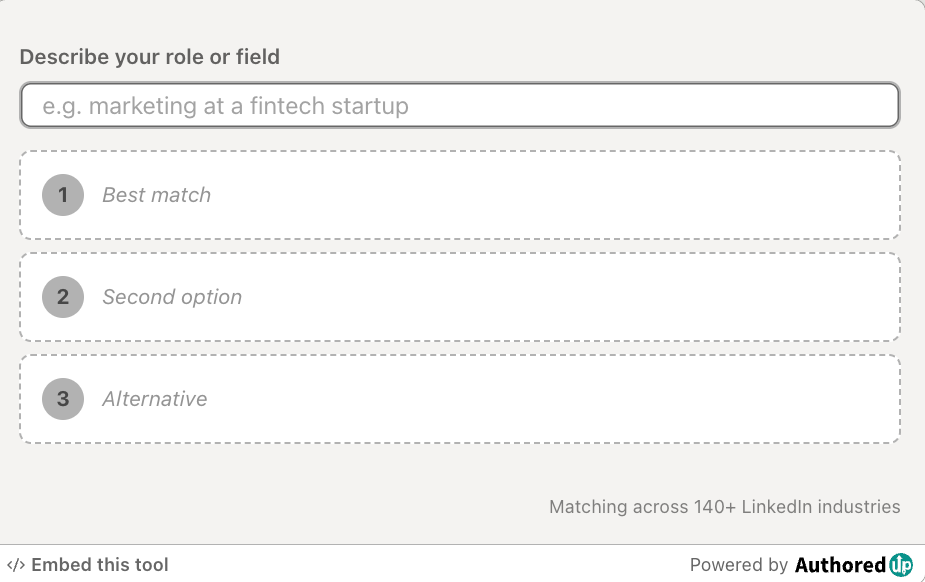
LinkedIn industry finder
Describe what you do and find the right LinkedIn industry for your profile from the official list of 289 options.
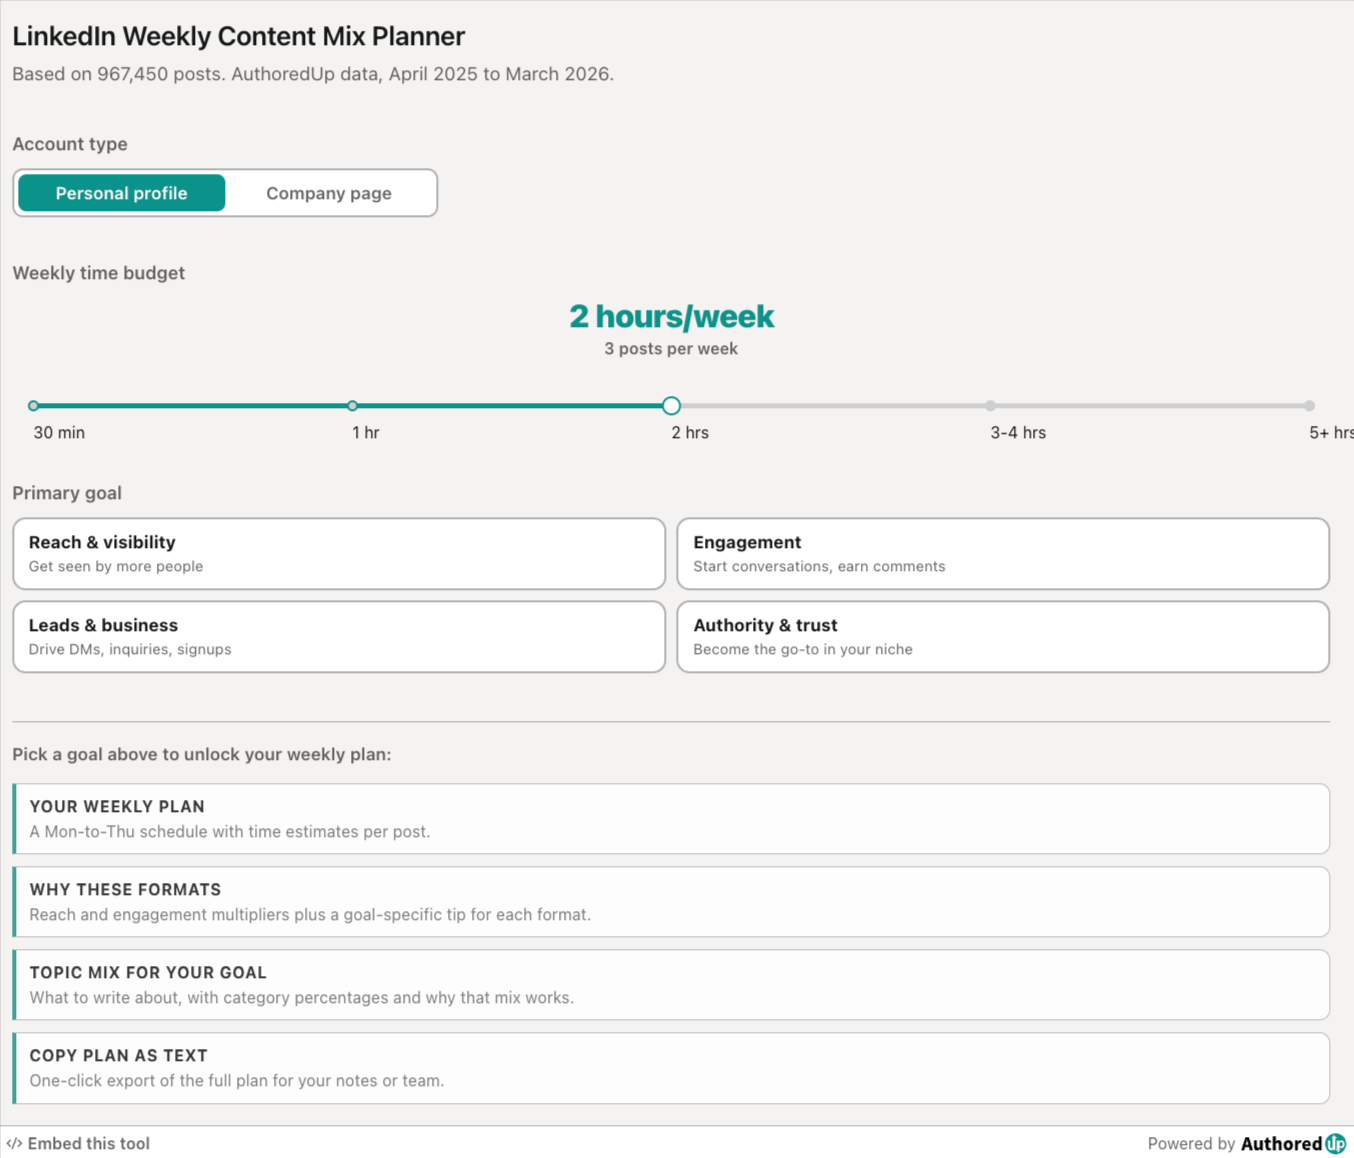
LinkedIn weekly content mix planner
Pick your goal and time budget, get a weekly LinkedIn posting plan with the right format and topic mix.
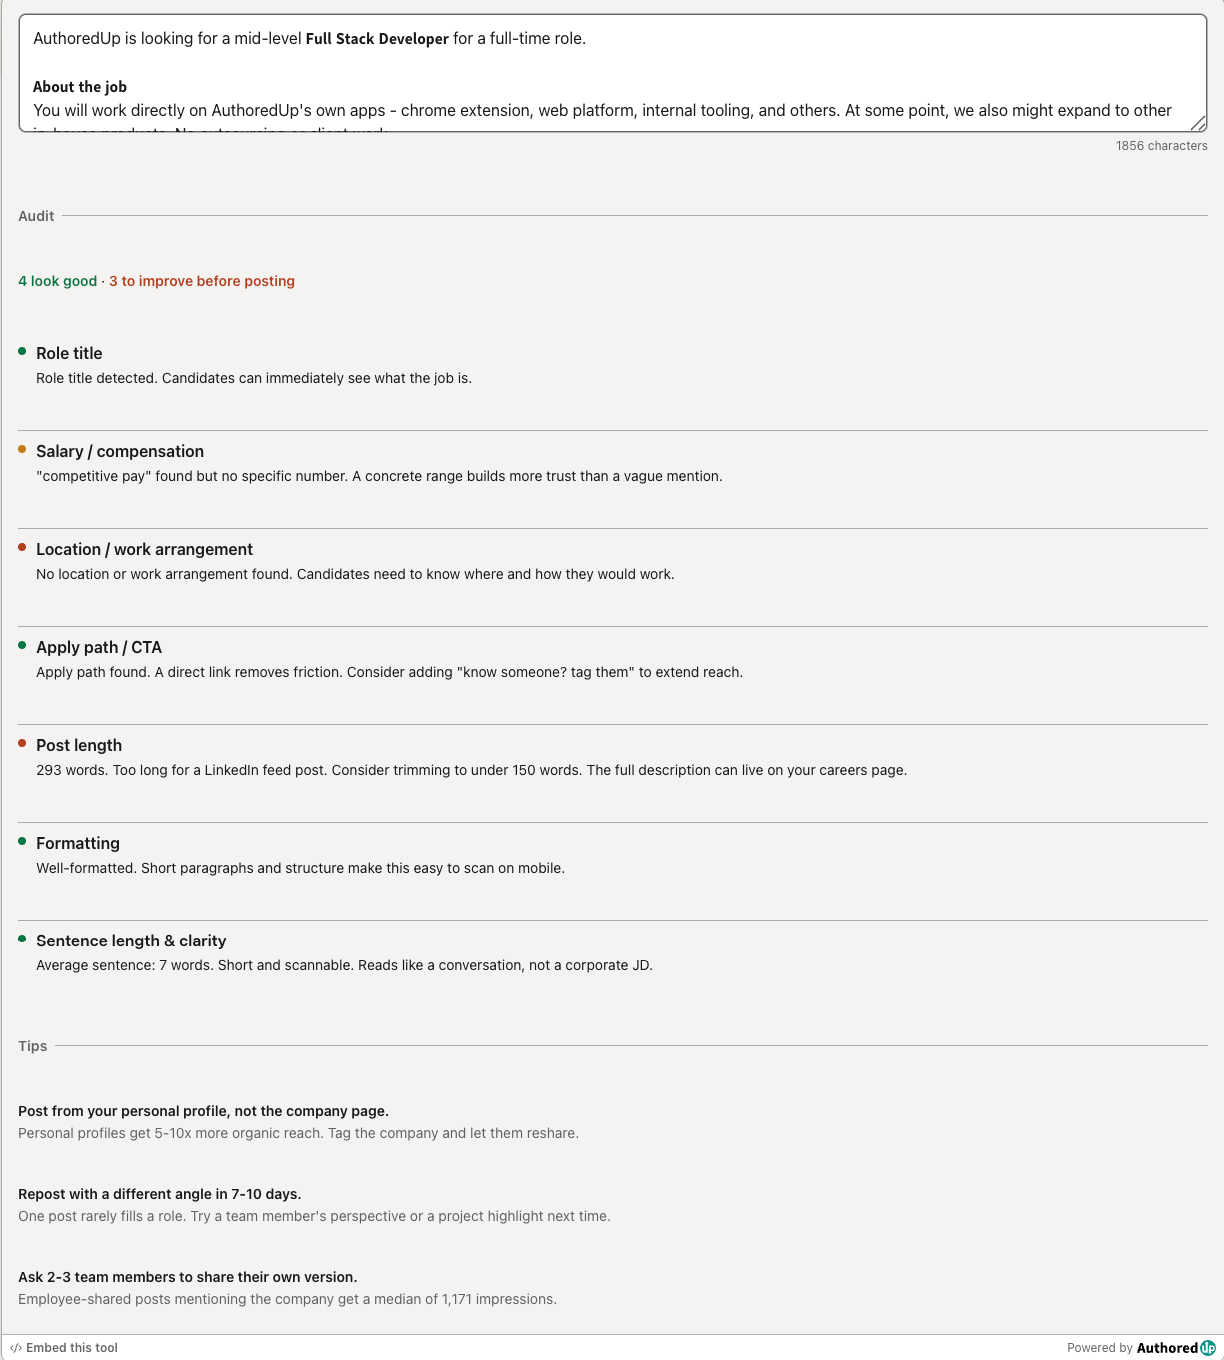
LinkedIn hiring post audit
Paste your LinkedIn hiring post and score it across the 7 elements that drive more applications.
LinkedIn Image Size Checker
Drop in an image or type its dimensions to check it against LinkedIn's real specs for posts, banners and covers.
Create your account today
Create and analyze your LinkedIn™ content in clicks, not hours.
100% secure. No automation. No cookies.