


.svg)

.png)
Ask Claude why your last post underperformed and you'll get a confident answer. It will talk about hooks, about posting times, about how the first line needs to grab attention.
It has never seen your post.
That's the thing worth understanding before you copy another prompt from anywhere: on its own, Claude has no access to LinkedIn. Not to your posts, not to your impressions, not to the reactions you got at 9am on a Tuesday. So when you ask it to diagnose your performance, it answers from general advice about LinkedIn, and general advice is what you get back.
Most Claude-for-LinkedIn prompt lists work around that blindness the same way. They ask Claude to write a headline, an About section, a post, because writing is the only thing it can do without your data. The prompts you actually want are the ones it can't run yet.
We connected Claude to our own post data and ran nine prompts that only work once it can see your numbers.
Why Claude can't see your LinkedIn posts
Claude has no built-in connection to LinkedIn. It has no LinkedIn account of its own, and LinkedIn does not expose post performance to third-party crawlers.
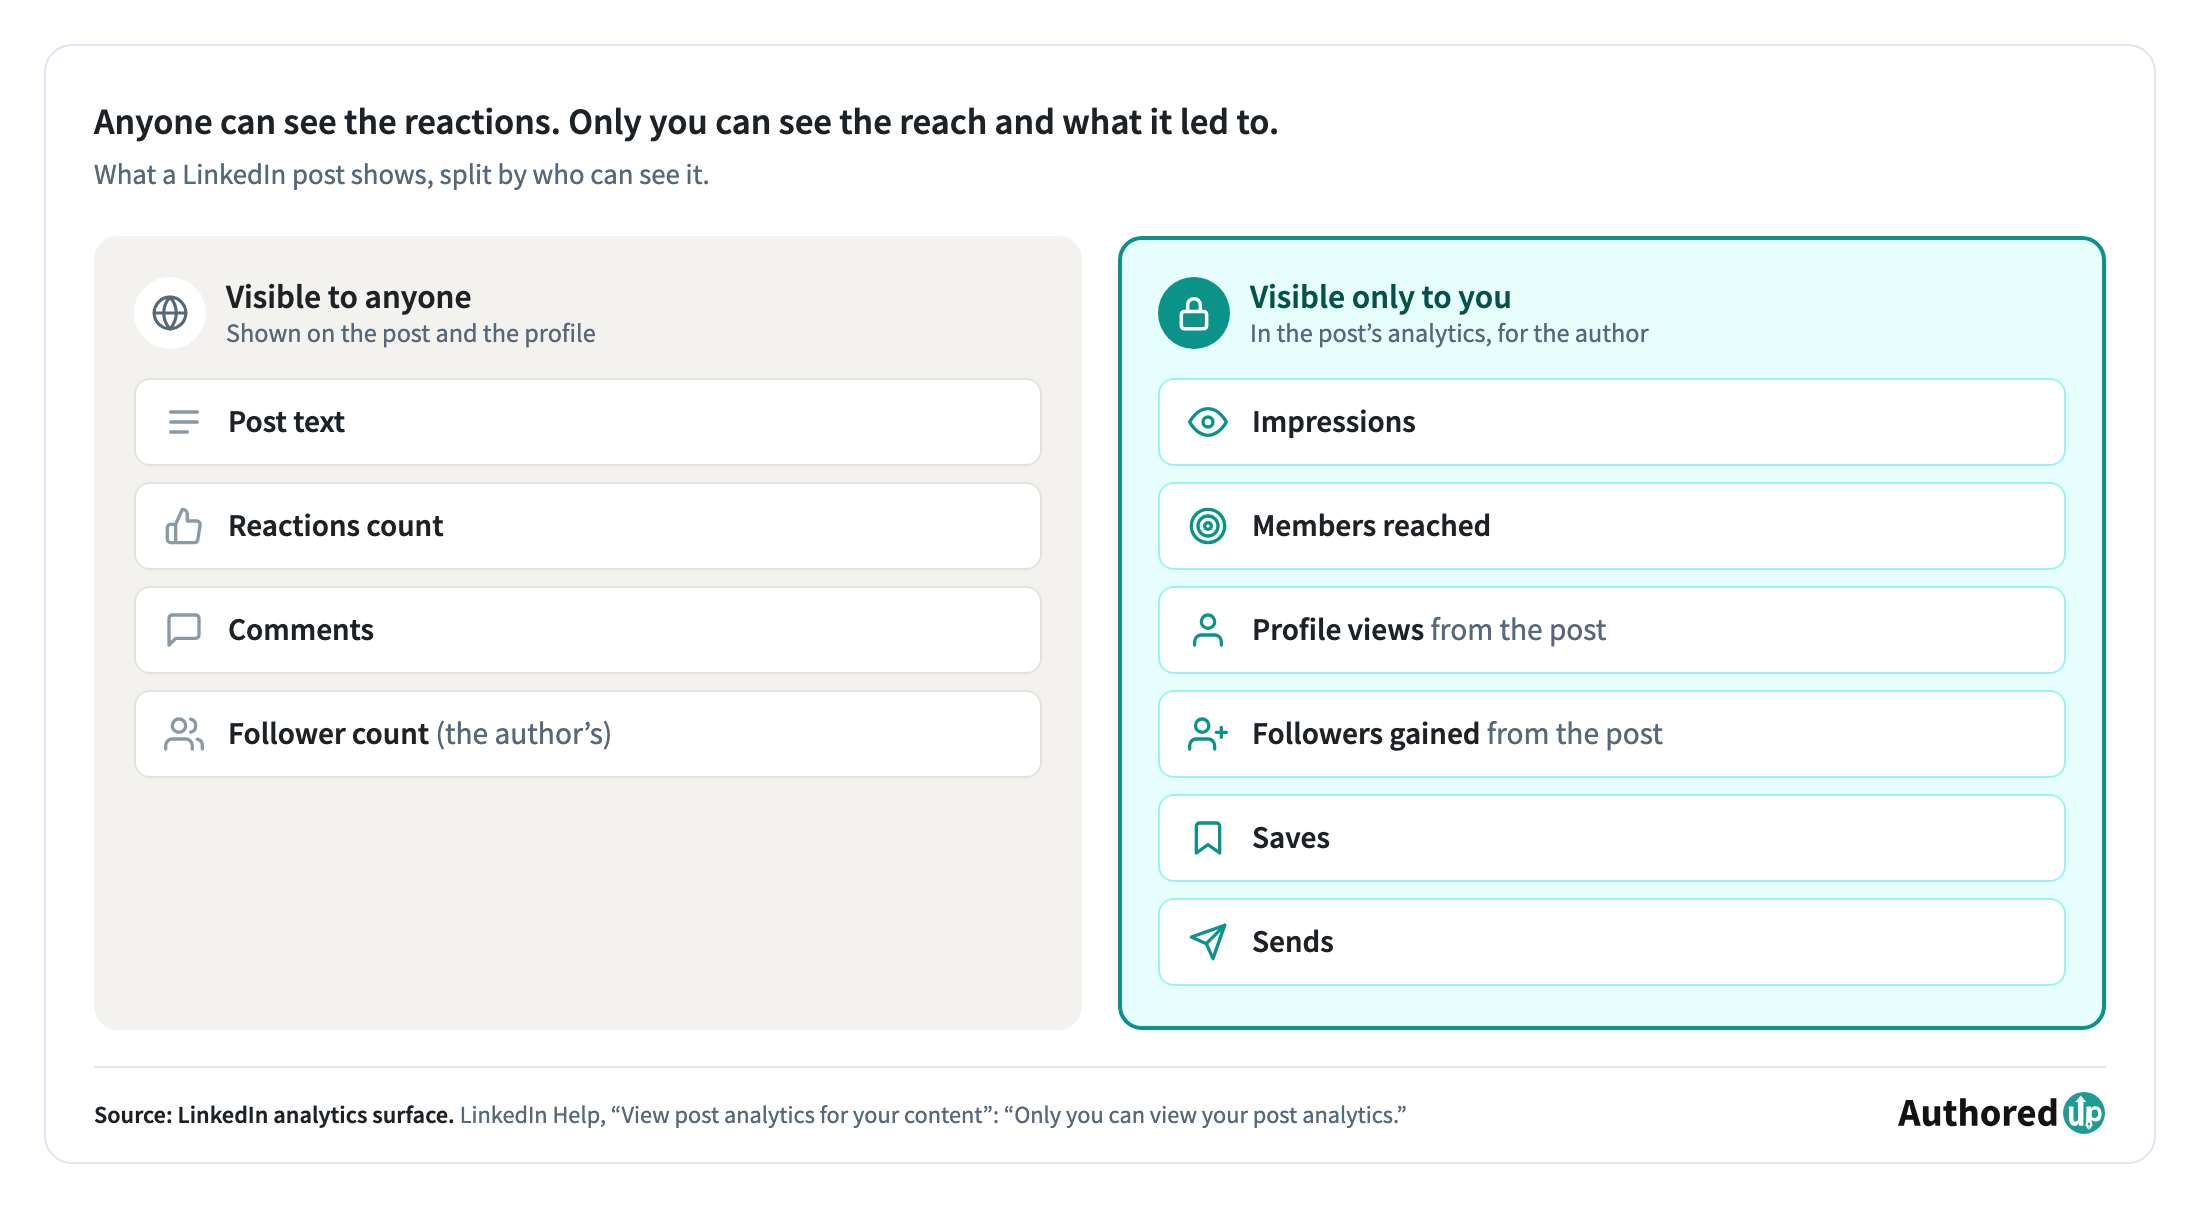
There's a second reason, and it's the more interesting one. Most of the numbers that matter are owner-only by design. Impressions, members reached, profile views and followers gained are shown to the person who published the post and to nobody else: not to your followers, not to a scraper, not to any tool that isn't authenticated as you. LinkedIn's own help page puts it in one line: only you can view your post analytics.
That distinction matters when you're choosing how to connect the two. A tool that scrapes public LinkedIn pages can read your post text, your follower count and your comment count, because those are visible to anyone. It can't read your impressions, and not because it's badly built: that data was never on the page it's reading.
We went looking for the exception and didn't find one. Apify's own published sample dataset for its LinkedIn scraper returns name, headline, connections, followers, job history and skills, and not a single performance metric. When we pulled our own posts through an authenticated connection, impressions and engagement rate were right there.
So "connect Claude to LinkedIn" can mean two different things: reading what anyone can see, or reading your own numbers. Most tools you'll find do the first.
Why does LinkedIn block Claude?
LinkedIn restricts automated access to its pages, and that includes AI assistants fetching pages on your behalf. If you paste a LinkedIn URL into Claude and ask it to read the post, it will often fail or return nothing useful.
This isn't Claude being broken. LinkedIn's User Agreement restricts scraping and automated data collection in its list of don'ts (section 8.2), and the site actively blocks unauthenticated crawlers. Any workflow built on "let the AI browse LinkedIn for me" is fragile at best and against the platform's terms at worst.
Can Claude control my LinkedIn account?
Not on its own, and you should be careful with anything that gives it that power.
The category worth avoiding is the one that drives your logged-in browser session to act on LinkedIn. Several open-source LinkedIn connectors work exactly this way, and so does any browser agent you set loose in a tab where you're signed in to LinkedIn. Automated activity through your real session is the kind of thing that gets accounts restricted, and the risk lands entirely on you.
The safer pattern is an authenticated connection to a tool that already holds your data with your permission, using OAuth you can revoke at any time. Claude reads what you've allowed and nothing else.
There are more kinds of LinkedIn connection than these two, and they differ a lot in what they do to your account. Our guide to LinkedIn MCP servers compares them all.
Can't you just paste or upload your posts?
You can, and plenty of people start there. Copy a post and its numbers into the chat, or download your posts and attach the file. Claude will read whatever you give it and answer properly.
The trouble shows up by the third or fourth conversation. Every new chat starts empty, so you paste the posts in again. Every new post means another copy-paste or a fresh download. And halfway through a longer analysis you find yourself reminding Claude which posts you meant, what the numbers were and what you'd already worked out together.
A downloaded file is also a snapshot. The day after you export it, it's missing your latest post and every reaction since.
Connecting through MCP takes all of that away. Claude pulls the posts it needs when you ask, straight from your AuthoredUp account rather than from a file you exported weeks ago. So the question can be as short as "how did last week's posts do?", and the answer is about last week. It's the difference between briefing a colleague from scratch every morning and giving them a login.
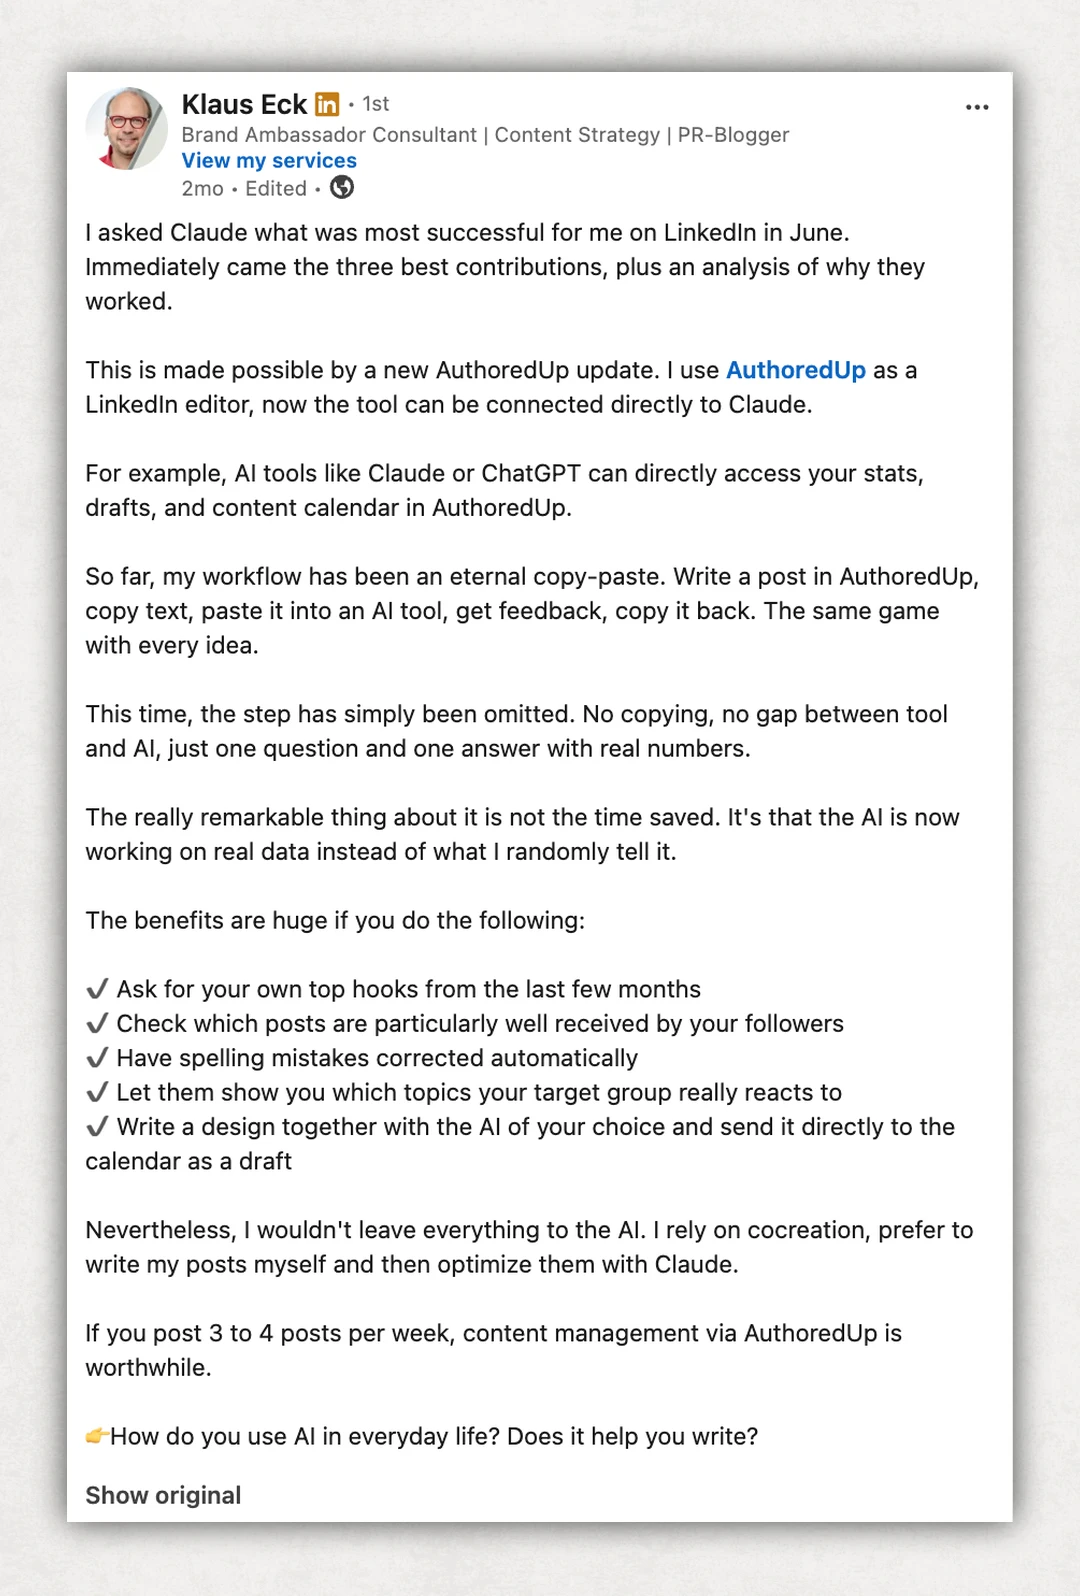
Klaus Eck, a brand ambassador consultant who writes his posts in AuthoredUp, described the same shift after connecting it to Claude. His workflow used to be the copy-paste loop: write in AuthoredUp, paste into the AI, copy the feedback back. Then he asked Claude what worked best for him in June and got his three strongest posts back, with an analysis of why. He still writes the posts himself; the difference is that Claude now works from his real numbers instead of whatever he remembers to tell it:
Setting it up
The AuthoredUp connection is a remote MCP server at https://backend.authoredup.com/mcp, and it's the one we used for every prompt below. You add it in Claude as a custom connector or in ChatGPT through Developer mode, then sign in with OAuth, so there's no key to copy or paste. Claude's Free plan allows one custom connector; in ChatGPT it works on Business, Enterprise and Edu workspaces, with read-only access on Pro. Our LinkedIn MCP guide walks through setup in each assistant with screenshots, and our help article keeps the current menu paths.
Once it's connected, Claude reads your posts and their numbers straight from your AuthoredUp account. It can write back, too, into your drafts, which is where prompt 9 ends up.
Prompts that measure, not prompts that write
Here's where it gets useful. Once Claude can read your posts, the prompts worth running change completely. You stop asking it to generate and start asking it to count.
We tested the connection on our own account and checked every prompt against the data it actually returns. Each one notes what it uses, so you can tell whether it will work on your posts.
1. Which of my posts actually beat my own average?
"Pull my last 90 days of posts. Show me median engagement rate across all of them, then list every post that beat it, with its engagement rate and impressions."
Uses your engagement rate and impressions. Works on personal profiles and company pages.
Start here, because it reframes the question. A post's reaction count mostly tracks how many people saw it, so 300 reactions from 30,000 impressions is a weaker result than 60 from 2,000. Engagement rate against your own median tells you whether the post did well for you.
For context: on personal profiles, the median engagement rate is 2.50%, and the middle half of posts falls between 1.41% and 4.16%. That range matters more than the median. A 4% post isn't a fluke and a 1.4% post isn't a failure: both are normal.
2. Is my engagement rate good for my follower count?
"What's my follower count right now, and what's my median engagement rate over my last 90 days of posts? Tell me which follower bracket that puts me in."
Uses your follower count and engagement rate.
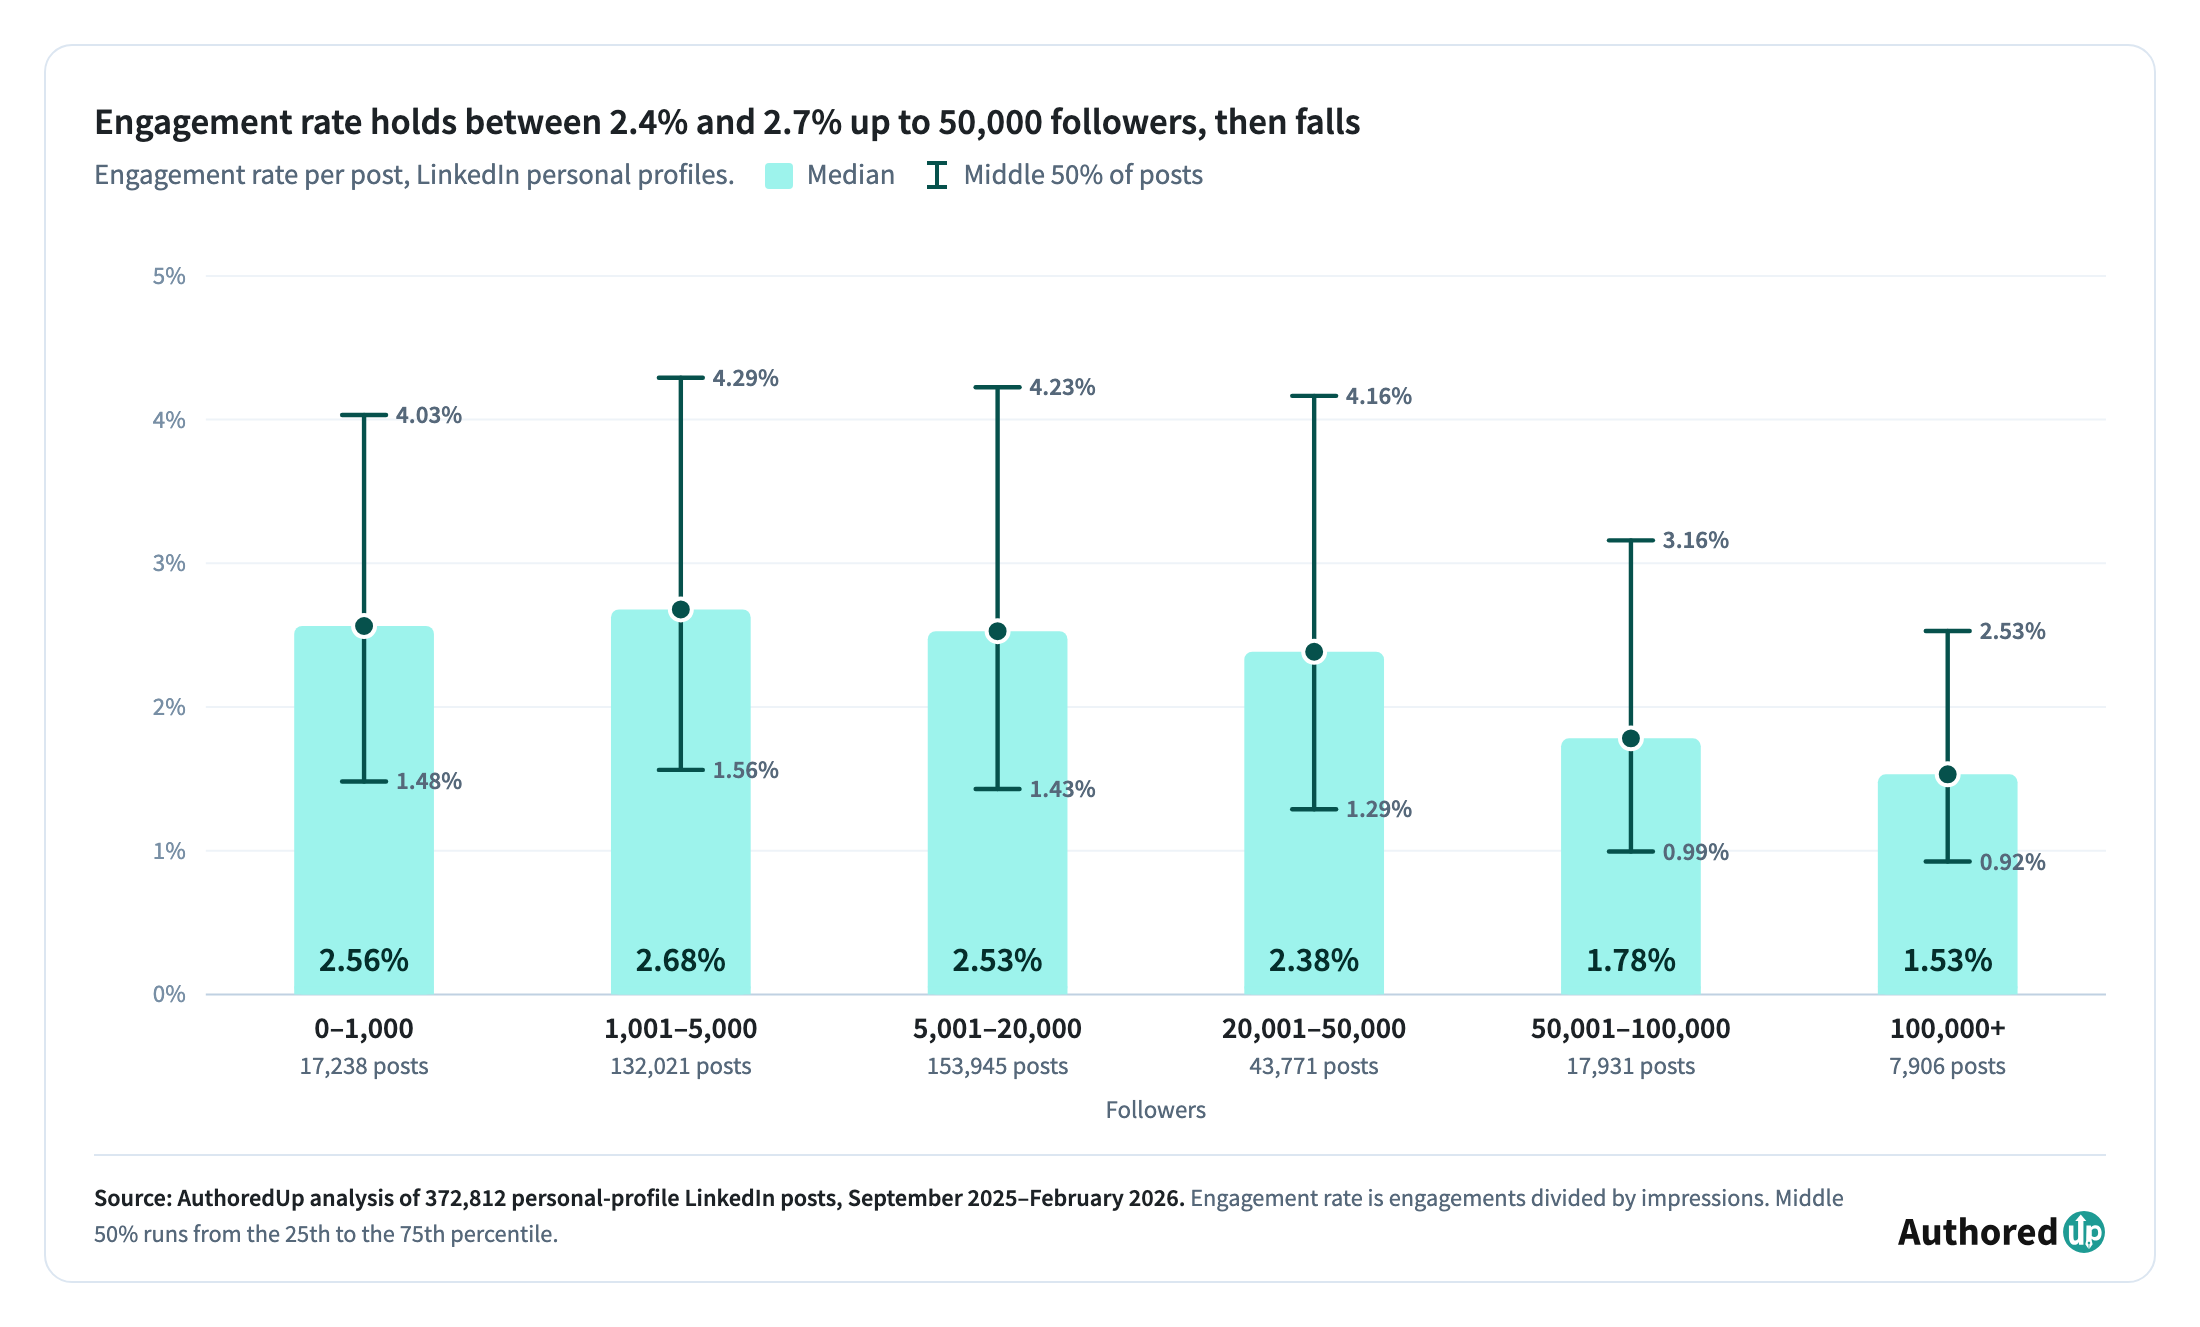
Then compare against your bracket. Engagement rate eases off past about 5,000 followers and drops clearly past 50,000:
Personal profiles, 372,812 posts, September 2025–February 2026.
If your engagement rate has been drifting down as you grow, check your row first. An account at 80,000 followers holding 1.8% is performing at the median for its size. The same 1.8% at 2,000 followers is below par. Engagement rate is engagements divided by impressions, and as an account grows, impressions tend to rise faster than the number of people who respond. A slowly falling percentage while your follower count climbs is the normal shape of growth, not evidence that something broke.
Accounts with 1,001–5,000 followers have the highest median of any group, so a small audience is no handicap here.
3. How long are my posts, and does length track with performance?
"Bucket my last 90 days of posts by character count into 1–400, 401–700, 701–1000, 1001–1300, 1301–2000, 2001–2500 and 2501–3000. Show me the count and median engagement rate in each bucket."
Uses each post's character count and engagement rate.
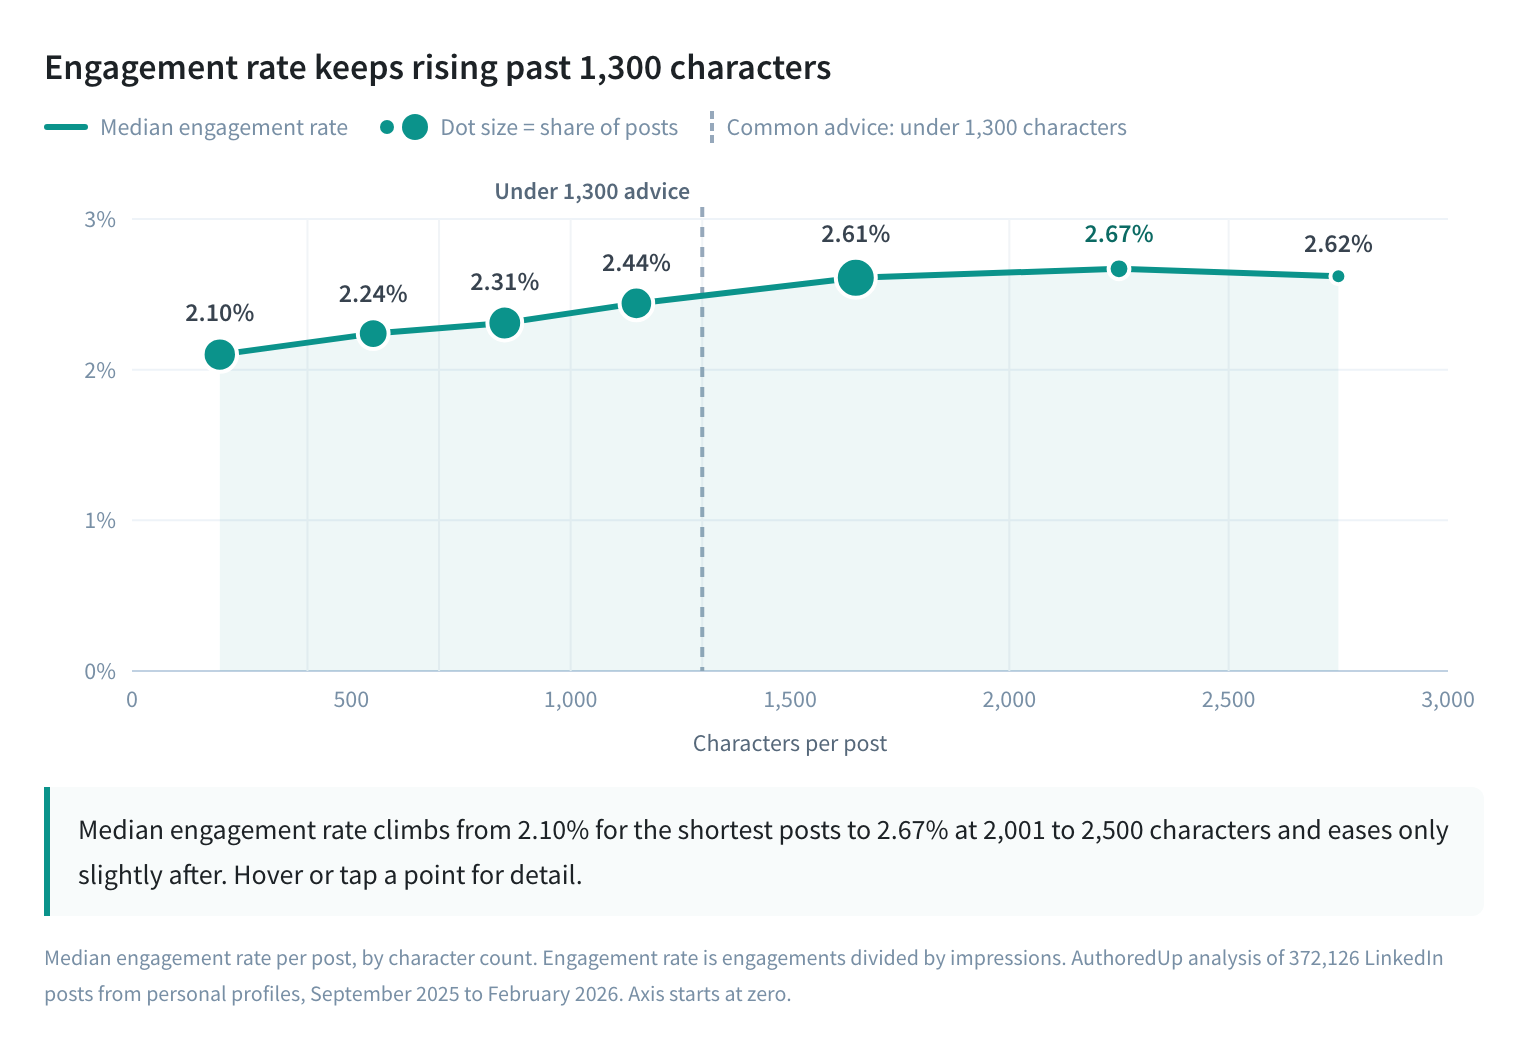
This is the prompt that tends to surprise people. A common line in AI prompt guides is to keep LinkedIn posts "under 1,300 characters", but in our data engagement rate keeps climbing past that point:
372,126 posts from our dataset. The comparison with each author's usual reach below uses 116,251 text-only posts from personal profiles, July 2025–June 2026.
Engagement rate peaks at 2,001–2,500 characters and only eases slightly after that. Nearly a quarter of posts are 1,301–2,000 characters long, already above the limit those guides recommend, and well inside LinkedIn's 3,000-character cap.
Don't cut a post down just to hit a character ceiling. Engagement rate holds up past 1,300 characters, so a longer post isn't being penalized for its length.
Reach looks like it rewards long posts too, but that's mostly who writes them: just ten creators write one in eight of the very longest posts. Compare each post with its author's usual reach and the picture flattens. Posts of 1,200–1,500 characters do best, about 7% above their author's usual reach. Very long posts land slightly below it. Only very short posts clearly lose: under 400 characters, about 14% below.
So write to the length the idea needs. Length matters less than either the "keep it short" or the "go long" camp suggests.
4. What kind of hooks do I actually write?
"Take the first line of each of my last 90 days of posts. Classify each as story, contrarian, statement, results or question. Show me how many of each I write and the median engagement rate for each group."
Uses the text of your posts and their engagement rate.
Hook styles separate more than you might expect:
Personal profiles, 309,614 posts, December 2025–May 2026.
Question hooks are a staple of hook advice, and they finish last. Story openers beat them by about 20%. If Claude tells you most of your openers are questions, that's the first thing to test.
Ending with a question doesn't do much either way. Posts that end with one sit at 2.33%, against 2.26% for posts that don't. Adding "What do you think?" is close to a rounding error. We went deeper into this in our breakdown of LinkedIn hook examples.
5. How many emojis do I use?
"Count the emojis in each of my posts from the last 90 days. Group by emoji count and show median engagement rate and median impressions for each group."
Uses each post's emoji count, engagement rate and impressions.
The useful finding here is that the whole effect happens between zero and two:
Nearly half of all posts use no emoji at all, and they have the lowest median reach in the table. After two, the curve flattens: eight emojis do about as well as three. If you use none, one or two is the change worth testing. If you're already at six, the seventh isn't doing any work.
6. How readable is my writing?
"Show me the readability index for each of my last 20 posts alongside its engagement rate. Are my higher-performing posts easier or harder to read?"
Uses each post's readability index and engagement rate.
This one works because the connection returns a readability score for every post, which is unusual. Most analytics tools stop at counts and never look at the writing itself.
The score is the Automated Readability Index, which works like a US school grade. An 8 means an eighth-grader could read the post comfortably; a 14 is undergraduate level. It's based on how long your words and sentences are, so it drops when you swap a long word for a short one or split a long sentence in two. It doesn't judge whether the idea is any good, only how hard the reader has to work.
The median LinkedIn post scores 5.6, around a fifth- or sixth-grade level. The middle half sits between 3.7 and 7.9, and only one post in ten scores above 10.5. So if yours come back at 11 or 12, you're writing denser than nine in ten posts on the feed.
In the raw numbers, easier reading tracks with better results:
Personal profiles, 326,293 posts with more than 100 impressions and an engagement rate under 10%, December 2025–May 2026. Scores below zero come from very short words and very short sentences, which in practice means posts written in short fragments. The comparison with each author's usual reach below uses 116,123 text-only posts, July 2025–June 2026.
From the 0–2 band to above 10, median engagement rate slips and median impressions fall by a third. Length doesn't explain it: posts scoring 2–4 and 8–10 are almost exactly as long.
Most of the gap comes from who writes dense posts. Compare each post with its author's usual reach and it nearly closes: posts scoring under 4 land about 1% above their author's usual reach, and posts scoring 10 or more about 2.5% below.
If Claude tells you your recent posts average 10 or above, splitting long sentences is a cheap edit worth trying. Expect a nudge, not a jump: for the same author, readability moves reach by a few percent, not by a third.
7. What's my reaction mix?
"Break down my reactions by type across my last 90 days (Like, Celebrate, Support, Love, Insightful, Funny) and show me which posts pulled the most non-Like reactions."
Uses the breakdown of reactions by type.
Total reactions tell you how many people responded. The mix tells you how, and the two don't always move together. A post can pull fewer reactions overall but far more Insightful ones, which says something different about who read it.
Here's what a normal mix looks like:
Personal profiles, 234,818 posts with more than 100 impressions, an engagement rate under 10% and at least 10 reactions, December 2025–May 2026. Shares are worked out per post and then the median taken, so a handful of viral posts don't set the numbers.
If about four in five of your reactions are Likes, your mix is ordinary. Most posts get no Insightful, Support or Funny reactions at all, so even a few of those put a post above the median.
The last column is the interesting one. Posts where Love makes up more than a fifth of the reactions have the highest median engagement rate in the table. Posts heavy on Insightful or Funny have the lowest. The likely reason is the kind of post that draws each one: Love lands on personal news and stories, which people reply to, while Insightful lands on information people read, agree with and scroll past. Like everything in these tables, it's a correlation, so don't start fishing for Love. Use the mix to read what kind of response a post actually got.
8. How does this year compare with last year?
"Compare my posts from the last 12 months with the 12 months before that. For each year, show how many posts I published, my median engagement rate and median impressions, and my three best posts. What changed?"
Uses your full post history, including posts from before you joined AuthoredUp if you've imported your LinkedIn archive.
Every prompt so far looks at 90 days. That's enough to see what's working now, but not whether you're getting better. For that you need last year, and that's where most connections come up empty: a tool that started tracking the day you signed up has nothing from before it.
AuthoredUp can import your LinkedIn archive, the data export LinkedIn sends you on request, so years of posts are there even if you joined last week. The question stops being "how did my last post do?" and becomes "am I better at this than I was a year ago?"
9. Draft the follow-up
"Take my best-performing post from the last 90 days. Keep the core insight but propose three new angles, then write the strongest one as a draft and save it to my AuthoredUp drafts with a planned time for Tuesday morning."
Uses your engagement rate and the connection's draft tool.
Claude writes the draft straight into AuthoredUp, and it arrives looking the way Claude wrote it, with bold, italics, lists and staircase styling intact. Tell it which profile or company page the post is for, and ask for a reminder as well: AuthoredUp notifies or emails you when it's time to post.
The planned time has to be in the future, and it's your plan rather than a scheduled job, so the last step stays with you. Open the draft, check the preview, add an image if the post needs one, and publish.
That's the loop worth having: read your numbers, work out what they mean, write the next post against them, and ship it from the same place, without copy-pasting between four tabs.
Put it all in one report
Each prompt above answers one question. Once you know which ones matter to you, you can ask for all of them at once and get a report back instead of a long chat answer.
This is the prompt we ran on Ivana's profile:
"Look at the last 20 LinkedIn posts on my profile (Ivana Todorović) and tell me what's actually working for me. Compare my older posts with my most recent ones. Look at engagement rate, comments, saves and followers gained, and check whether topic, length, the opening line or the format lines up with the difference. If a number is missing for a post, say so instead of estimating. Give me the 3 patterns you're most confident about, show which posts back up each one, and tell me what my best posts have in common (hook, length, reactions). Then suggest what I should post next. Put it all in a one-page report as an artifact: a few headline numbers at the top, one chart, a table of the posts, and the takeaways in plain language."
Uses your engagement rate, comments, reactions and text metrics, plus saves and followers gained where they're available. Put your own name in place of Ivana's.
Three parts of it do most of the work. Naming the profile keeps Claude on your posts if your AuthoredUp account covers a whole team. Asking it to flag missing numbers stops it filling gaps with guesses, since saves and followers gained aren't there for every post. And asking for the patterns it's most confident about, with the posts behind each one, means you can check its reasoning instead of taking its word for it.

Claude pulls the posts, works through them and builds the report next to the chat:
The pattern Claude was most sure of was about what the posts do, not how they look. Ivana's 2026 posts get a higher engagement rate than her older ones, but fewer new followers, and the report traced that to a change in type: most of her older posts handed the reader a rule they could use, while most of this year's reframe an idea, share an opinion or tell a personal story. It held up when we opened the posts. The one 2026 post that gives a rule, "Your posts don't underperform", has more saves than any other post this year and more than twice the new followers. Claude's suggestion for what to post next follows from that: the practical fix her impressions post left out.
The report stays in the conversation, so you can keep asking questions of it ("why is this post in the bottom three?") or ask Claude to draft the post it suggested, the same way as prompt 9.
A few things that make these prompts work better
We ran every prompt here on our own account first, and two things made the difference.
Build your prompts on impressions, reactions, comments and engagement rate. They reliably come with your posts, so a prompt built on them always has something to work with. Members reached, profile views, followers gained and link clicks show up when available, which makes them a nice bonus and a shaky backbone. Reactions come split by type on almost every post, so prompt 7 works as written.
And use your saved posts. Save a few from people in your niche and they become a swipe file Claude can read: ask what their openings have in common, or how long the ones you liked run. Their impressions stay with their authors, just as yours stay with you, so any tool claiming to show you a rival's reach on a specific post is estimating.
Frequently asked questions
Can Claude connect to LinkedIn?
Not directly. Claude has no built-in connection to LinkedIn. The reliable way is through a tool that already holds your LinkedIn data with your permission: an authenticated connection you approve and can revoke.
Is Claude good for LinkedIn?
For writing, it's about as good as any capable model, which means it produces competent, generic posts unless you give it something specific to work from. For analysis, it's genuinely useful once it can read your actual performance data. It will happily bucket 90 days of posts by length and compute medians per bucket, which is tedious by hand.
Why can't Claude access LinkedIn?
LinkedIn restricts automated access to its pages, and most performance data is only visible to the account that published the post. Both limits are deliberate. The way around them isn't a cleverer prompt, it's an authenticated connection.
Does this work with ChatGPT too?
Yes. The connection standard is open, so any assistant that supports it can use the same tools. In ChatGPT you add it through Developer mode on a Business, Enterprise or Edu workspace. Pro accounts get read-only access, which is enough for every prompt here except the draft in prompt 9.
Do I need a paid plan?
The AuthoredUp connection is included on every AuthoredUp plan, with no separate tier or add-on. The assistant has its own rules, which we checked in September 2026: Claude allows one custom connector on its Free plan and more on paid plans, while ChatGPT supports it on Business, Enterprise and Edu workspaces through Developer mode, with read-only access on Pro.
Is it safe?
It runs on OAuth, following the MCP specification's authorization rules, so you approve the connection explicitly and can cut it off at any time. Nothing drives your logged-in LinkedIn session, which is the risky pattern to watch for in open-source LinkedIn connectors. Automated activity through your real session is what gets accounts restricted.
Where to start
If you run one prompt from this post, make it the length breakdown. It's the one most likely to contradict what you've been told, and it takes about ten seconds to check against your own posts.
Then find your row in the follower-bracket table. An engagement rate only means something next to accounts your size.
You can also see the same numbers in your AuthoredUp analytics, as a dashboard, when you'd rather look than ask. The connection just means you can ask about them in a sentence. If you don't use AuthoredUp yet, start a 14-day free trial and import your LinkedIn archive, and your post history is there from day one.
.svg)
.png)
.svg)
.png)

.png)