


.webp)
Ever pondered on the untapped potential of LinkedIn analytics to track and analyze your performance effectively?
A well-crafted LinkedIn analytics dashboard can provide the insights you need to optimize your content strategy and boost engagement.
In today’s article we have a special treat for you!
Are you ready to transform your LinkedIn strategy?
Dive into our step-by-step guide and use our free template to build your LinkedIn analytics dashboard today!
Build Your LinkedIn Analytics Dashboard in 5 Easy Steps
Step 1: Access LinkedIn Analytics
First things first, to create a LinkedIn Analytics Dashboard, you need to access your LinkedIn Analytics.
This step is crucial because it’s where all the magic begins – your analytics data. Without it, you can't track or improve your performance.
Here’s how to get there:
1. Log In: Sign in to your LinkedIn account.
2. Navigate to Your Company Page: Click on your profile icon and select your company page from the dropdown menu.
3. Admin View: Make sure you’re in the admin view of your company page. This view gives you access to all the necessary tools and data.
4. Analytics Section: On the left side of your screen, click on ‘Analytics’.
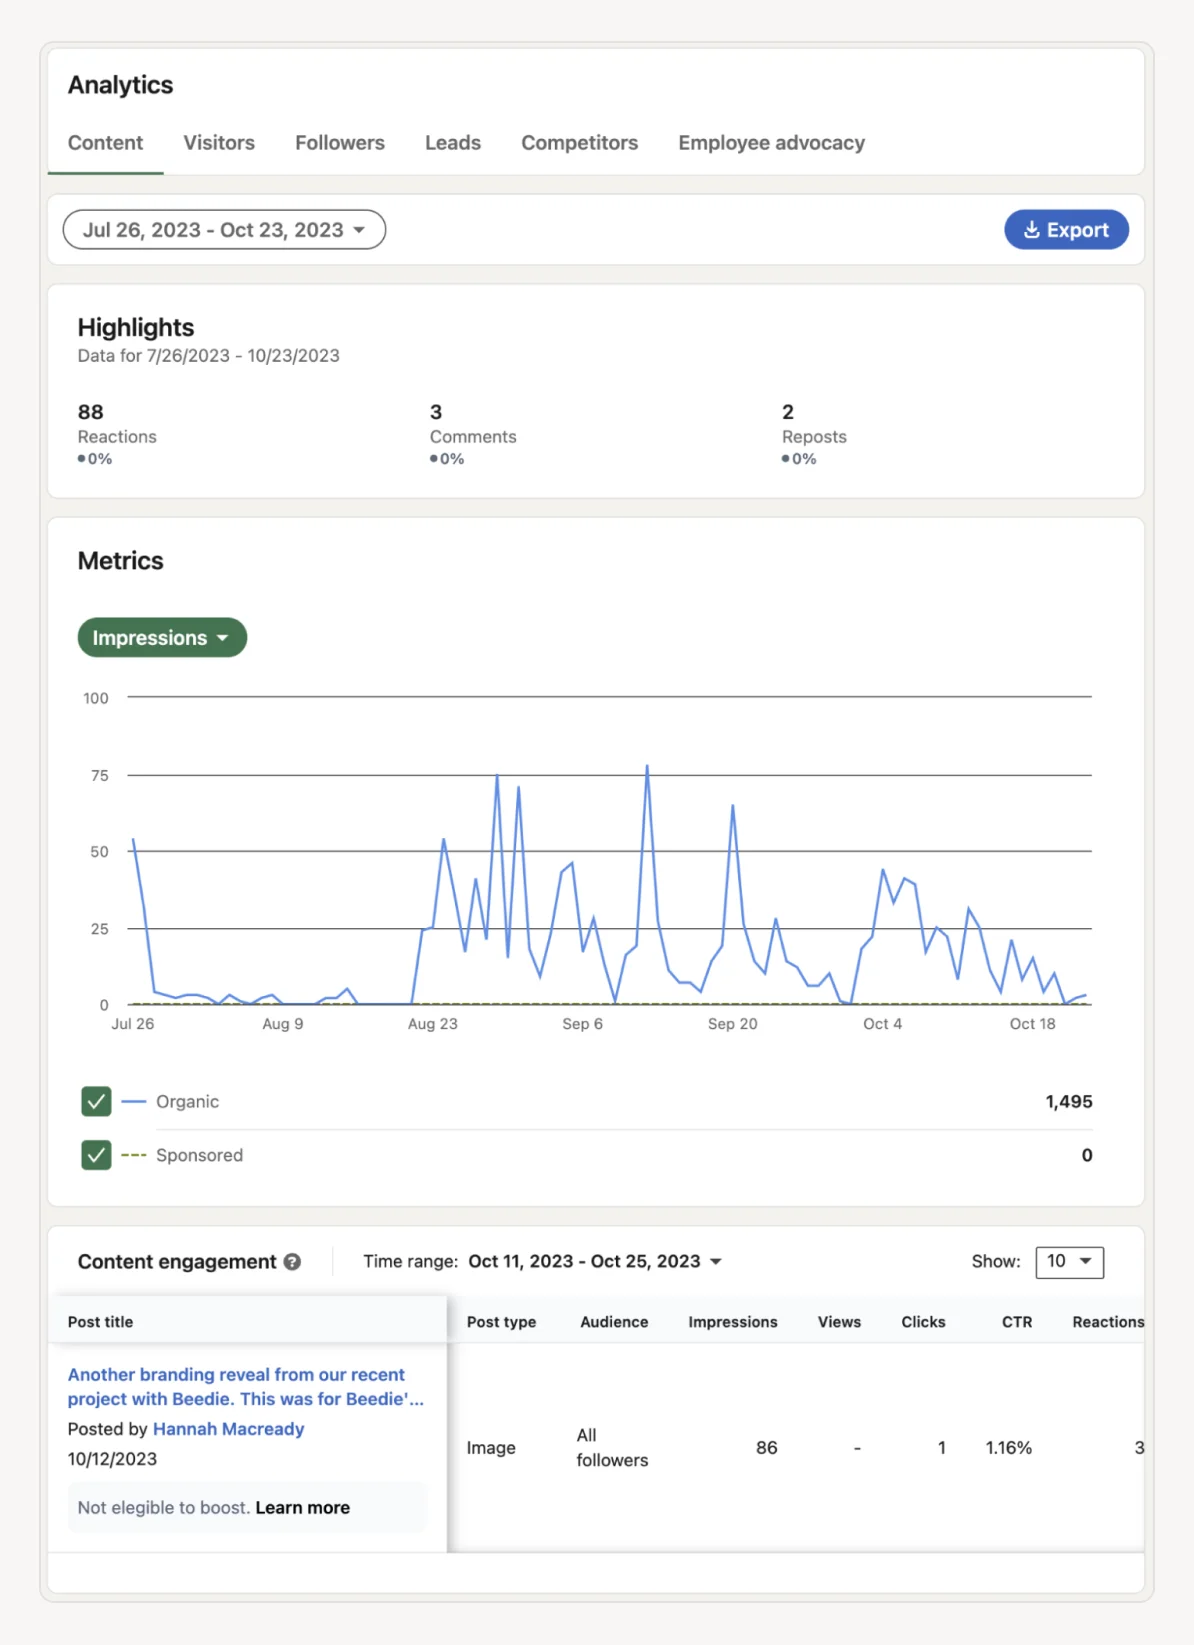
Step 2: Collect Key Metrics
Now that you’ve accessed LinkedIn Analytics, it’s time to gather key metrics.
This step is essential because these metrics provide a snapshot of your page's performance, helping you understand what’s working and what needs improvement.
Here’s how to collect the data:
1. Overview Tab: Start with the overview tab to get a broad view of your page's performance.
2. Visitors, Updates, and Followers: Dive deeper into data on visitors, updates, and followers. Focus on these key metrics:
3. Impressions: The number of times your content is displayed.
4. Clicks: The number of times users click on your content.
5. Engagement Rate: The percentage of interactions (likes, comments, shares) relative to impressions.
6. Follower Metrics: Track growth in followers, demographics, and more.
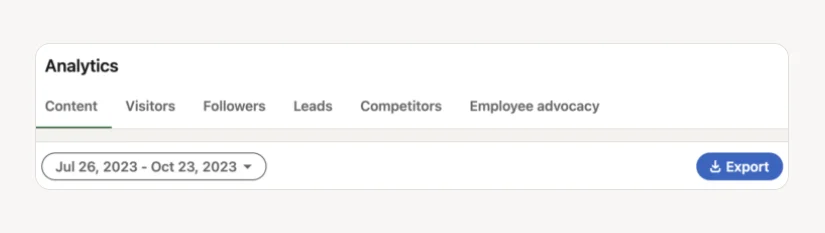
Step 3: Export Data
With your key metrics collected, the next step is to export your data.
Having your data in a CSV file allows for easier analysis and the creation of custom reports.
Here’s how to do it:
1. Download Reports: Most sections of LinkedIn Analytics offer the option to download data as a CSV file.
2. Export Button: Click on the 'Export' button, usually located at the top right of each analytics section.
3. Custom Date Ranges: Select specific date ranges for a more targeted analysis, ensuring you focus on the most relevant data.
Step 4: Create the Dashboard
Now comes the fun part – creating your LinkedIn Analytics Dashboard.
This step enables you to transform raw data into visual insights, making it easier to understand and act upon.
Here’s how to set it up:
1. Use a Tool: Choose a tool like Excel, Google Sheets, or a dedicated dashboard tool (e.g., Tableau, Power BI) to create your dashboard.
2. Import Data: Import the CSV files you downloaded from LinkedIn Analytics into your chosen tool.
3. Set Up Key Metrics: Organize your dashboard to display essential metrics such as impressions, engagement rate, clicks, shares, and comments.
4. Visualize Data: Use charts, graphs, and tables to bring your data to life:
- Line Charts: Perfect for tracking performance over time.
- Bar Charts: Ideal for comparing metrics across different posts.
- Pie Charts: Great for demographic breakdowns.
Step 5: Analyze and Adjust
With your dashboard set up, it’s time to make it work for you.
Regularly reviewing and adjusting your strategy based on data insights is key to continuous improvement.
Here’s how to achieve this:
👉 Review Regularly: Make it a habit to check your dashboard frequently. This ensures you stay updated on your performance.
👉 Identify Trends: Look for patterns or trends in your data. Are certain types of posts consistently performing better?
👉 Adjust Strategy: Use the insights gained to tweak your content strategy. For instance, if you notice videos get more engagement, incorporate more videos into your posts.
Example Setup in Google Sheets
1. Import your CSV files into Google Sheets.
2. Create sheets for each metric.
3. Create a main dashboard sheet summarizing the key metrics.
4. Insert charts and graphs to visualize the data.
5. Use formulas to calculate engagement rates, averages, and other necessary metrics.
Now let’s put this into practice, shall we?
LinkedIn Analytics Dashboard Template
Here's a basic template for a LinkedIn Analytics Dashboard using Google Sheets.
You can customize it based on your specific needs and preferences.
Example Setup for Sheet 1: Impressions
This sheet tracks key metrics for each post, including the date, post title, impressions, clicks, and engagement rate.
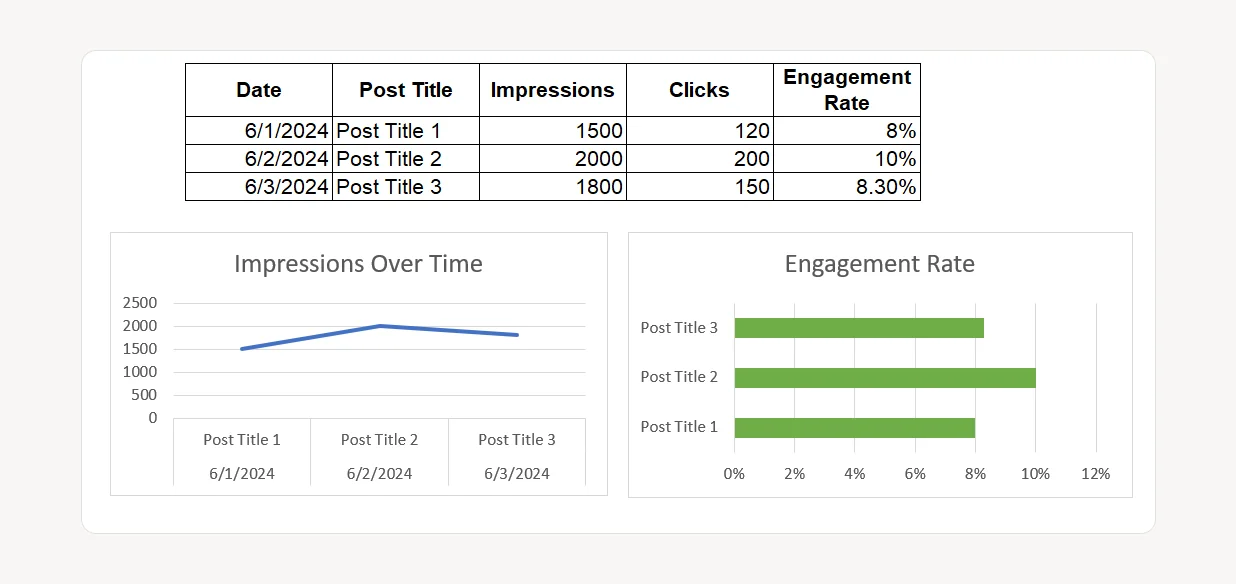
Charts for Sheet 1
1. Impressions Over Time
▶️ Data Selection: Select the date and impressions columns.
▶️ Insert Chart:
- Go to Insert > Chart.
- In the Chart Editor, choose Line chart.
- Adjust the chart settings as needed.
2. Engagement Rate Comparison
▶️ Data Selection: Select the post title and engagement rate columns.
▶️ Insert Chart:
- Go to Insert > Chart.
- In the Chart Editor, choose Bar chart.
- Adjust the chart settings to compare engagement rates across posts.
By setting up Sheet 1 and its associated charts, you can easily track and visualize the performance of your posts in terms of impressions and engagement rates.
This helps you identify trends and make data-driven decisions to improve your LinkedIn strategy.
Example Setup for Sheet 2: Engagement
This sheet tracks engagement metrics for each post, including the date, post title, likes, comments, shares, and total engagement.
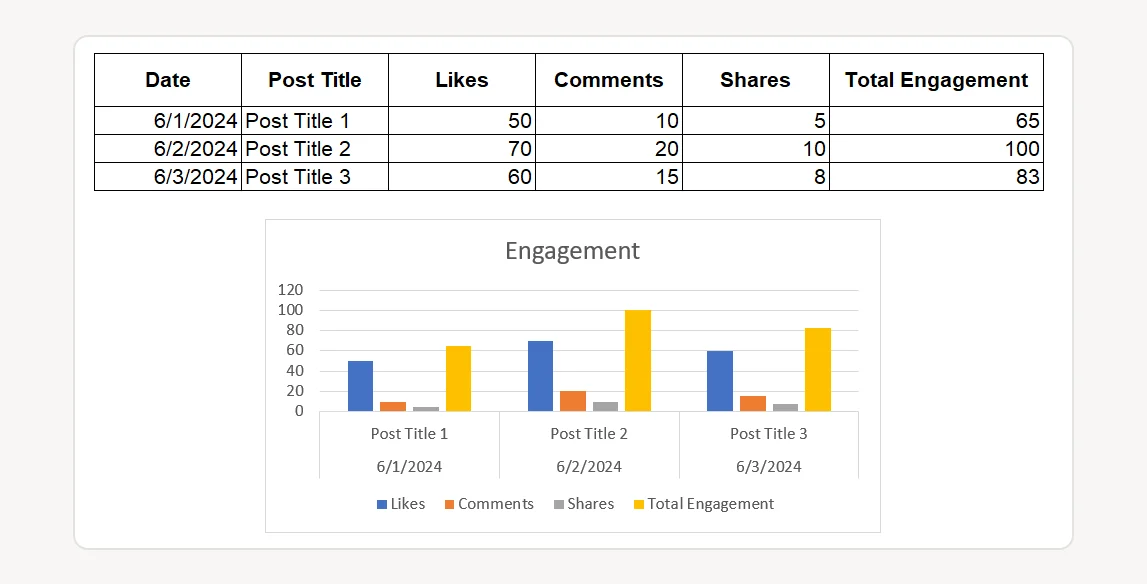
Chart for Sheet 2
Engagement Comparison
▶️ Data Selection: Select the post title and total engagement columns.
▶️ Insert Chart:
- Go to Insert > Chart.
- In the Chart Editor, choose Bar chart.
- Adjust the chart settings to visualize total engagement across different posts.
By setting up Sheet 2 you can easily track and compare the engagement of your posts and understand which content resonates most with your audience.
This enables you to fine-tune your LinkedIn strategy for better performance.
Example Setup for Sheet 3: Follower Metrics
This sheet tracks follower metrics, including the date, new followers, total followers, and demographics.
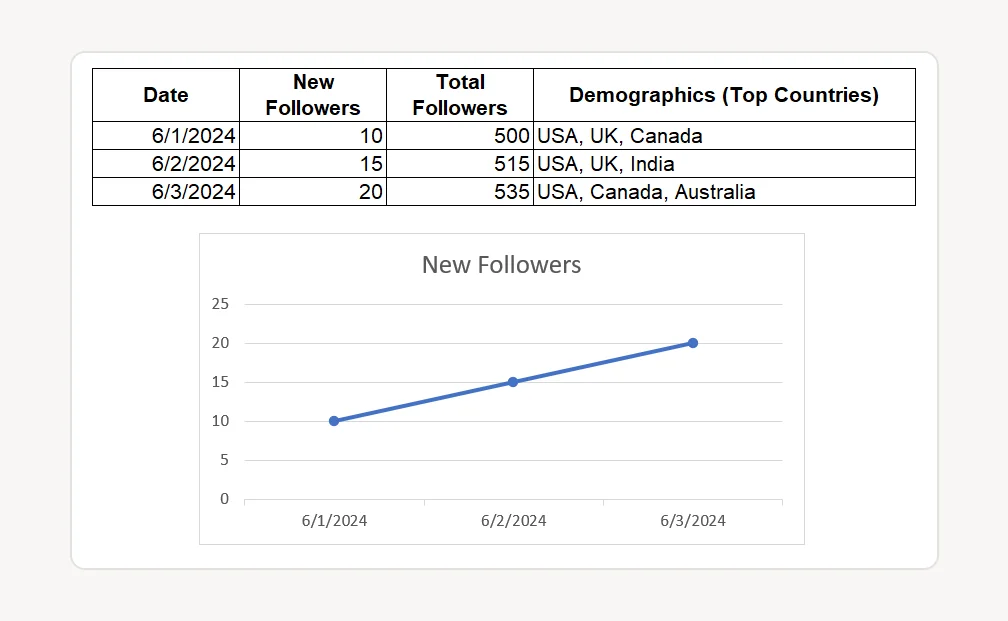
Chart for Sheet 3
New Followers Growth
▶️ Data Selection: Select the date and new followers columns.
▶️ Insert Chart:
- Go to Insert > Chart.
- In the Chart Editor, choose Line chart.
- Adjust the chart settings to visualize the growth of new followers over time.
By setting up Sheet 3 you can track the growth of new followers and understand the demographics of your audience.
This helps you tailor your content and engagement strategies to better connect with your target audience and drive growth on LinkedIn.
Example Setup for Sheet 4: Top Posts
This sheet tracks the performance of your top posts, including the date, post title, impressions, engagement rate, and top hashtags.
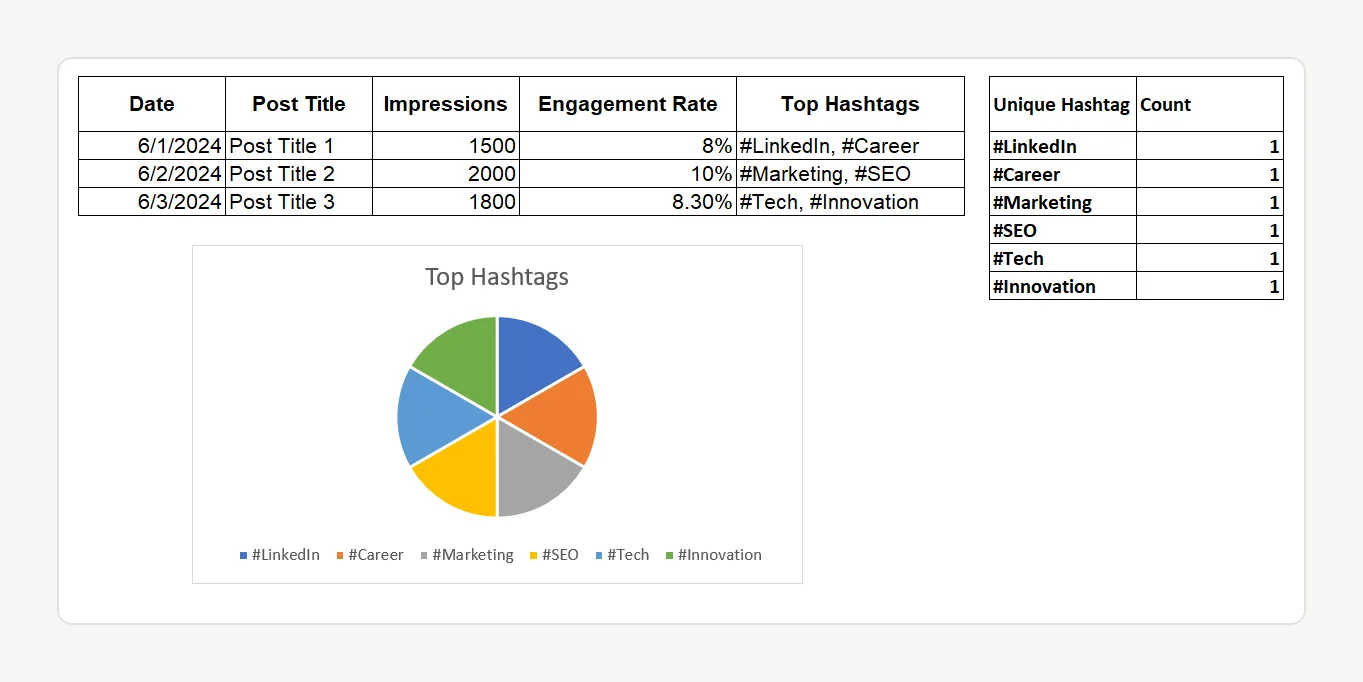
Tracking Top Hashtag Usage
1. List Unique Hashtags
▶️ Create a separate table within the same sheet or in a new sheet to list all unique hashtags used in your posts.
▶️ You may need to compile this list manually if your hashtags are in a comma-separated format.
2. Count Hashtag Occurrences
▶️ Use the COUNTIF function to count the occurrences of each hashtag in your posts.
▶️ Example Formulas:
- For #LinkedIn: =COUNTIF(Top Posts!E:E, "*#LinkedIn*")
- For #Career: =COUNTIF(Top Posts!E:E, "*#Career*")
- For #Marketing: =COUNTIF(Top Posts!E:E, "*#Marketing*")
- For #SEO: =COUNTIF(Top Posts!E:E, "*#SEO*")
- For #Tech: =COUNTIF(Top Posts!E:E, "*#Tech*")
- For #Innovation: =COUNTIF(Top Posts!E:E, "*#Innovation*")
Creating the Chart
▶️ Select Data: Highlight the unique hashtags and their counts.
▶️ Insert Chart:
- Go to Insert > Chart.
- In the Chart Editor, choose Pie chart (or Bar chart if you prefer).
- Customize the chart settings to clearly display the distribution of hashtag usage.
By following these steps, you can effectively track and visualize the usage of hashtags in your LinkedIn posts.
This helps you identify which hashtags are most effective in driving engagement, guiding your future content strategies for better visibility and interaction on LinkedIn.
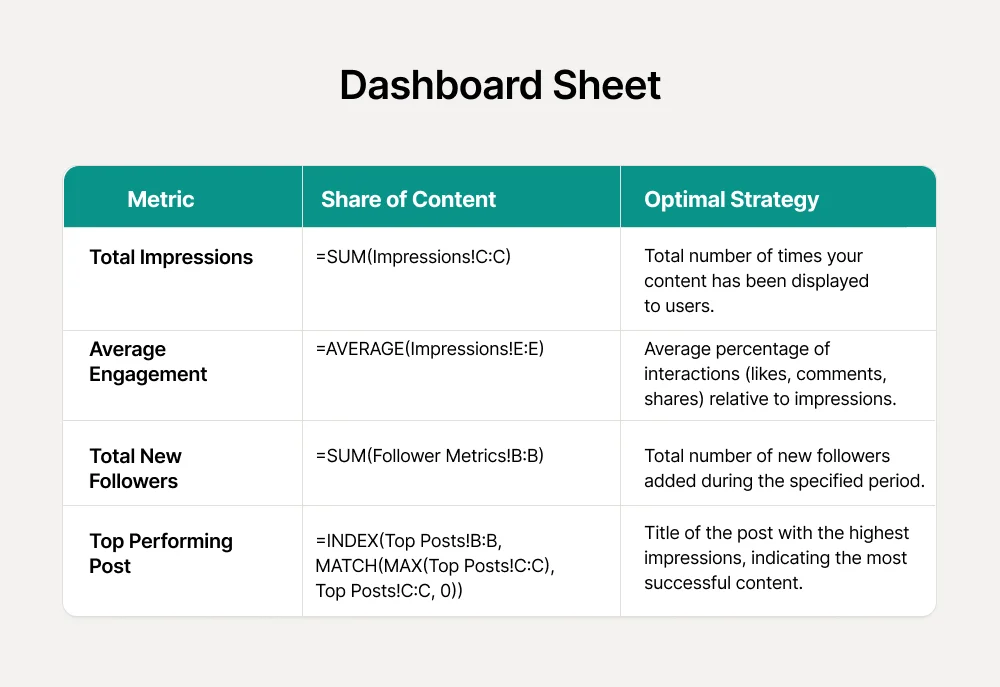
Example Setup for Sheet 5: Dashboard (Summary)
This sheet provides a summary of key metrics, giving you an overview of your LinkedIn performance.
Here is what the Dashboard sheet includes:
Dashboard Preview
By following the table above, you should get something like this:
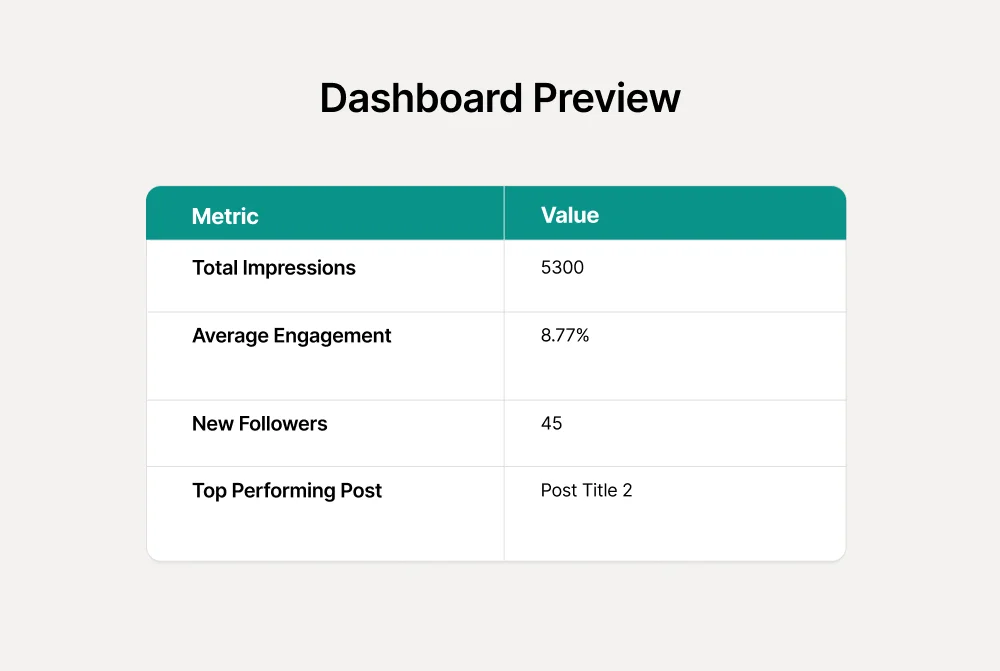
By setting up this Dashboard (Summary) sheet, you can quickly get an overview of your LinkedIn performance.
This summary helps in identifying trends and making data-driven decisions to enhance your LinkedIn strategy.
Supercharge Your LinkedIn Performance with AuthoredUp Automation
Creating a LinkedIn analytics dashboard is essential for understanding your content's impact and optimizing your strategy.
By utilizing this LinkedIn analytics dashboard you can gain valuable insights into your:
✔️ audience engagement,
✔️ post performance, and
✔️ overall growth.
This analytical approach allows you to make data-driven decisions that enhance your LinkedIn presence and drive professional success.
However, if you prefer to monitor and analyze your data automatically, AuthoredUp can be of great help.
This tool stands out as the best solution for LinkedIn analytics due to its comprehensive and user-friendly features:
🌸 Post Feature – Allows you to review the performance of published content, gaining insights into post effectiveness and audience resonance.
🌸 Post Comparison – Compares posts over different time ranges, providing metrics such as impressions, views, shares, engagement rate, and total engagement.
🌸 Growth Timeline – Tracks the performance of your content over time, helping you understand growth trends.
🌸 Correlation Plot – Analyzes relationships between various metrics like impressions, reactions, comments, shares, total engagements, and readability.
🌸 Calendar View – Manages all your scheduled posts in one place for easy organization.
🌸 Hashtags – Optimize your hashtag strategy with a comprehensive table displaying frequency, comments, reactions, shares, and engagement rates.
🌸 Post Type Analysis – Determine the best-performing post types for your profile to align your content strategy effectively.
Moreover, these features are just the beginning of what AuthoredUp offers.
It can also help you:
- write your content,
- store ideas as drafts,
- save your favorite posts, and
- preview posts in real-time, among many other capabilities.
How to get started with AuthoredUp?
- Install the Chrome extension.
- Create your account and link it to your LinkedIn profile.
- Start exploring for free—no credit card required.
.png)
.png)
.png)
